- Service Details
- Case Study
PBMC Sample for Cytokine Assay
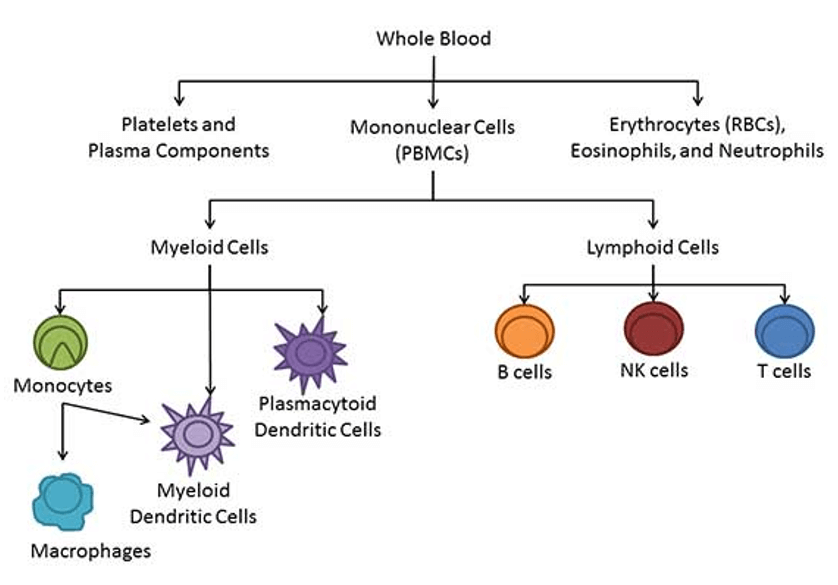
Peripheral Blood Mononuclear Cell (PBMC) is a mixed population of cells with a single nucleus in peripheral blood and is a rich source of immune cells. PBMC can be further purified to isolate individual cell types, consisting of lymphocytes (T cells, B cells, NK cells), monocytes, and granulocytes (neutrophils, basophils, eosinophils), with the highest percentage of lymphocytes followed by monocytes. Unlike single-cell analyses, PBMC samples offer a holistic view of the immune system's cytokine landscape.

PBMC are commonly used in immunogenicity assays, cell marker studies, and basic cell therapy research. For example, in cancer research, PBMC samples with different markers of cells. Tumor targets can be verified directly or by specific antibodies, detection of cytokines produced after stimulation of PBMC, etc.
Based on Luminex multiple cytokine assay technology, Creative Proteomics has built a PBMC sample assay platform that can provide you with molecular analysis of cytokines and proteins in PBMC samples.
Cells: PBMC, CD3+ T cells, CD4+ T cells, CD8+ T cells, NK cells, Treg cells, dendritic cells, macrophages, etc.
Application of the assay: cytokine release (single or multiple factors simultaneously, ELISA/Luminex), cell surface marker protein expression or immunophenotyping, etc.
Species
Technology Platform for Inflammation Cytokine Assay
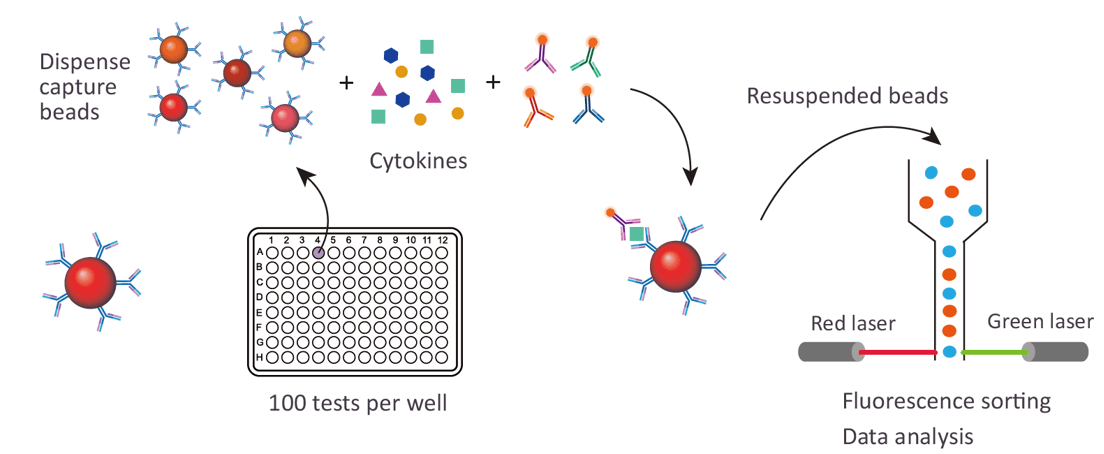
We mainly provide the Luminex cytokine detection platform. Luminex uses fluorescently encoded microspheres with specific antibodies to different target molecules. The different microspheres can be combined freely to a certain extent so that up to 100 analytes can be tested multiple times simultaneously in a single experiment.
The Luminex cytokine assay platform has the following advantages:
- Multiple detection: simultaneous detection of 100 biological targets
- Short experiment time: 2-6 weeks
- High sensitivity: the lower limit of accurate quantification is as low as 0.1 pg/mL
- Save samples: only need a sample volume as low as 25 μL
- Time saving: the experiment process only takes 4 hours

For your different needs, we can also provide the following detection methods:
- Simoa
- Meso scale discovery (MSD)
- Enzyme-linked immunosorbent assay (ELISA)
- Flow cytometry
Sample Requirements for PBMC Cytokine Assay
Sample Collection:
- Anticoagulant Choice: Use EDTA or heparin to preserve PBMC viability.
- Aseptic Technique: Ensure sterile techniques during blood collection to maintain PBMC purity.
- Timely Processing: Process samples promptly to avoid cell activation and cytokine profile alterations.
PBMC Isolation:
- Density Gradient Centrifugation: Utilize Ficoll for efficient PBMC isolation and minimize contamination.
- Gentle Handling: Handle PBMCs with care to prevent cell stress and maintain cytokine profiles.
Cell Viability Assessment:
- Viability Staining: Assess viability using trypan blue staining and aim for >90% viability.
Cryopreservation:
- Cryoprotectant Use: Use dimethyl sulfoxide to prevent cell damage during freezing.
- Controlled Freezing: Employ a slow freezing process for maintaining PBMC integrity.
Thawing Procedures:
- Gradual Thawing: Thaw PBMCs slowly to prevent cell shock and immediate processing to minimize post-thaw stress.
Luminex Assay Preparation:
- Standard Curve Controls: Include controls for accurate cytokine quantification.
- Assay Buffer: Use an appropriate buffer to maintain cytokine stability during the assay.
Data Analysis Quality Control:
- Standardization: Standardize data analysis procedures for consistency.
- Positive and Negative Controls: Incorporate controls in data analysis for quality assurance.
Creative Proteomics can provide you with a one-stop solution for cytokine and protein detection and quantification. If you would like to learn more, please contact us. We look forward to working with you.
Case Cytokine Profiling and Immune Dysregulation in Schnitzler Syndrome
Background
Schnitzler syndrome (SchS), initially described in 1972, gained recognition as an autoinflammatory disorder characterized by chronic urticarial exanthema, monoclonal gammopathy, and systemic inflammation. Limited understanding and underdiagnosis prompted a prospective study to elucidate cytokine profiles and immune responses in SchS patients.
Samples
The study included 36 patients with SchS, comprising 22 males and 14 females, between 34 and 84 years old. Blood samples were collected from untreated and anakinra-treated patients for both ex vivo analyses using peripheral blood mononuclear cells (PBMCs) and serum collection. A control group of 21 healthy volunteers was included for serum level analysis.
Technical Methods
Ethics: The study was approved by a research ethics committee.
Patients: Prospective multicentric study with 36 SchS patients recruited based on Lipsker and Strasbourg criteria. Treatment status (anakinra or untreated) was considered.
Samples: Blood samples collected in heparin tubes for PBMC isolation and dry tubes for sera. PBMCs isolated using Ficoll-Paque. Cell cultures included spontaneous and induced conditions.
Cytokine Measurements: IL-1α, IL-1β, IL-1RA, IL-4, IL-6, TNFα, IL-10, and IFNγ measured in serum and supernatants using Luminex 200™ platform. CRP concentrations quantified by immunoturbidimetry.
Statistical Analysis: Conducted using GraphPad Prism 5, including descriptive statistics, Kruskal–Wallis test, Mann-Whitney U test, and paired t-tests.
Results
Spontaneous release of IL-1β, IL-6, TNFα, and IL-1RA by PBMCs in SchS patients was higher than controls, with IL-6 and IL-1β showing the highest levels.
Activated T cells in PBMCs from SchS patients exhibited decreased production of IL-4, IL-10, IL17A, TNFα, and IFNγ, partially restored by anakinra treatment.
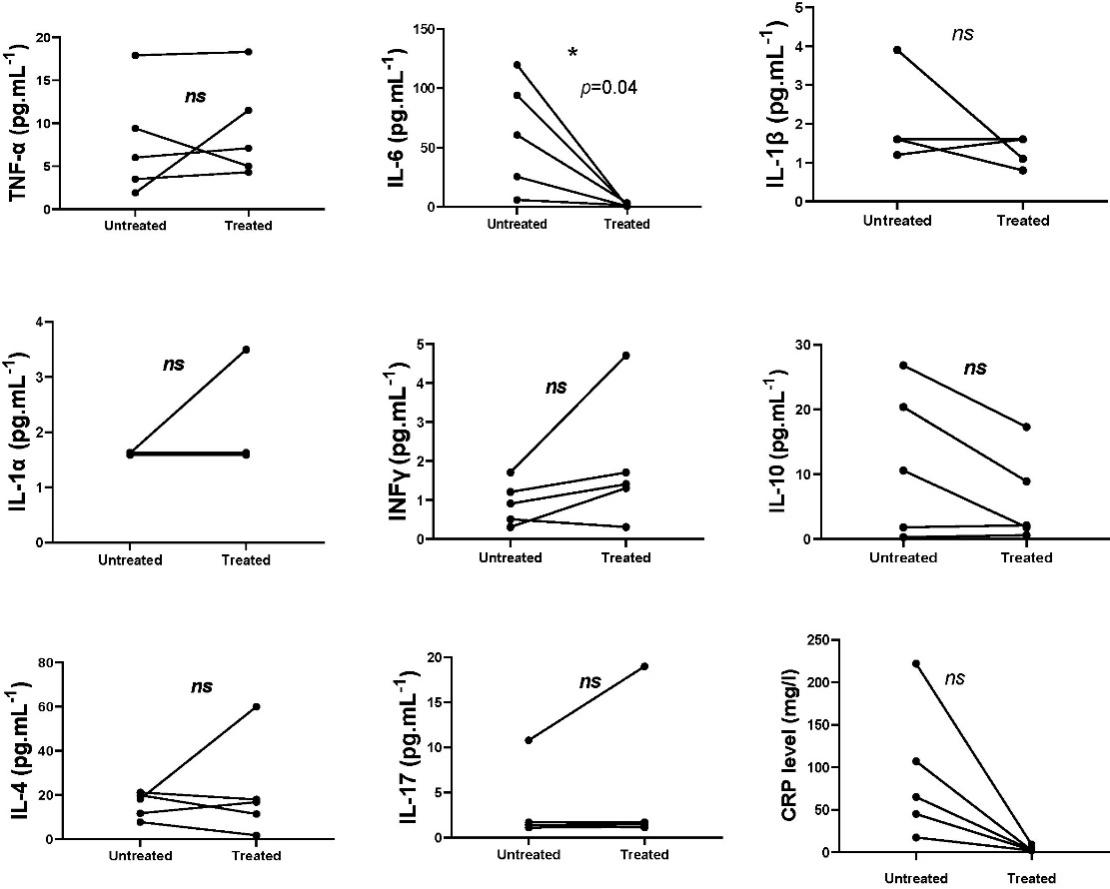
Serum levels of IL-6, IL-10, TNFα, IFNγ, and IL-4 were altered in SchS patients compared to controls, with significant changes observed after anakinra treatment.
IL-6 and CRP in serum correlated with disease activity, emphasizing their potential as markers for disease progression.
The T cell cytokine profile represented a specific signature of SchS patients, providing insights into the immunosuppressive nature of the disorder.
 Measurement of cytokine levels in patients pre and post-treatment with anakinra
Reference:
- Masson Regnault, Marie, et al. "Cytokine signature in Schnitzler syndrome: proinflammatory cytokine production associated to Th suppression." Frontiers in Immunology 11 (2020): 588322.

