
Overview of Luminex Technology
Luminex xMAP Technology represents a cutting-edge approach in multiplex biomarker analysis, revolutionizing both research and clinical diagnostics. This technology leverages color-coded microspheres, or beads, that are coupled with specific capture antibodies or probes to detect multiple analytes in a single sample simultaneously. Each bead set is distinctively encoded with a unique color combination, allowing for the parallel analysis of numerous biomarkers.
The applications of Luminex technology span various fields, including cancer research, immunology, and infectious diseases. Its ability to provide high-throughput, quantitative data from small sample volumes has made it an indispensable tool in both basic research and clinical diagnostics.
The efficacy of Luminex assays is heavily reliant on sophisticated data analysis. The sheer volume of data generated by these multiplex assays necessitates robust analytical methods to ensure accuracy and reliability. Effective data analysis not only helps in interpreting complex biological phenomena but also in making informed decisions in clinical settings. Challenges such as data preprocessing, statistical analysis, and result interpretation must be addressed to fully leverage the potential of Luminex assays.
Select Service
How Luminex Data is Generated
1. Bead-Based Detection System
Bead Preparation
Bead Types: Luminex assays use beads that are color-coded with unique fluorescent dyes. Each bead set is functionalized with capture antibodies or specific probes that bind to particular target analytes.
Bead Functionality: When a sample is added, target analytes interact with their corresponding beads. This binding event is specific and depends on the affinity between the analyte and the bead's capture agent.
Sample Interaction
Binding Process: During incubation, target analytes in the sample bind to the capture antibodies or probes on the beads. This interaction is specific to each bead type, allowing for the simultaneous measurement of multiple analytes.
Equilibrium: The binding reaches equilibrium as the sample interacts with the beads, ensuring that the amount of analyte bound is proportional to its concentration in the sample.
2. Fluorescence Detection
Flow Cytometry
Bead Sorting: After incubation, the beads are passed through a flow cytometer, which uses lasers to excite the fluorescent dyes on the beads. Each bead type emits a specific color, allowing the system to identify which analyte-specific beads are present.
Signal Emission: A second laser excites the fluorescent dyes attached to the beads. The fluorescence emitted is proportional to the amount of analyte bound to the beads.
Data Quantification
Signal Processing: The emitted fluorescence signals are captured by photodetectors and converted into digital signals. The intensity of these signals is measured to quantify the concentration of the target analyte.
Output Data: The final data includes bead identification (based on color coding) and fluorescence intensity, which is used to determine the concentration of each analyte in the sample.
3. Data Analysis
Software Processing
Data Compilation: The data from fluorescence intensity and bead identification are compiled by the Luminex software. This software processes the raw signals and translates them into quantitative measurements.
Statistical Interpretation: The processed data is analyzed to derive meaningful conclusions, such as comparing analyte concentrations across different samples or conditions.
Validation and Quality Control
Comparison with Standards: The results are validated by comparing them with known standards or control samples to ensure accuracy.
Reproducibility: Consistency is checked by replicating the assay under the same conditions to confirm the reliability of the results.
Luminex Data Collection Methods
Data collection methods in Luminex assays are crucial for ensuring that the data generated is accurate and reliable. This process involves several steps, from sample preparation to the operation of the detection system. Here's a detailed overview of these methods:
1. Sample Preparation
Collection and Handling
Sample Collection: Use sterile techniques and appropriate containers to collect biological samples. Common samples include serum, plasma, and cell lysates.
Storage Conditions: Store samples at the correct temperature to maintain stability. Short-term storage is typically at 4°C, while long-term storage requires freezing at -20°C or -80°C.
Preparation and Dilution
Sample Dilution: Dilute samples as needed to ensure that analyte concentrations are within the measurable range of the assay. This prevents saturation effects and ensures accurate readings.
Mixing and Homogenization: Ensure that samples are mixed thoroughly to achieve uniform distribution of analytes. This step is particularly important for samples that have been frozen and thawed.
2. Instrumentation and Operation
Bead Introduction
Loading: Add the bead-reagent mixture to the prepared samples. The beads are pre-coated with capture antibodies and are designed to interact with specific analytes.
Incubation: Incubate the mixture under controlled conditions to allow sufficient time for analytes to bind to the beads. Follow the specific assay protocol for incubation times and temperatures.
Flow Cytometer Function
Bead Sorting: The flow cytometer uses lasers to sort beads based on their unique color codes. This allows the system to identify the different bead types in the sample.
Fluorescence Detection: The instrument then uses a second laser to excite the fluorescent dyes on the beads. The intensity of the emitted fluorescence is measured to quantify the amount of analyte bound to each bead type.
3. Quality Control and Maintenance
Instrument Calibration
Routine Calibration: Regularly calibrate the Luminex instrument using known standards to ensure accurate and reliable measurements. Calibration helps in correcting any drift in the system's performance.
Maintenance: Perform routine maintenance and performance checks to address any issues with the detection system. This includes cleaning optical components and verifying the functionality of lasers and detectors.
Data Validation
Controls and Standards: Include control samples and standards in each assay run to validate the results and ensure the accuracy of the data.
Reproducibility Checks: Conduct replicate assays to confirm the consistency and reliability of the results. Ensure that the assay produces reproducible data across different runs and conditions.
Luminex Data Analysis Techniques
Data analysis in Luminex assays involves several steps to convert raw fluorescence signals into meaningful quantitative data. This process includes data normalization, statistical analysis, and interpretation. The use of specialized software and statistical methods is crucial for handling complex calculations required for analysis.
Data Cleaning
Removing Outliers and Artifacts: Identifying and removing outliers and artifacts is crucial to avoid skewed results. Statistical methods like the Tukey method or Grubbs' test can be used to detect outliers. Additionally, visual inspection techniques such as box plots can help in identifying extreme values that may distort the analysis.
Handling Missing Values: Missing data can occur due to various reasons, such as technical issues or sample handling errors. Methods for handling missing values include imputation techniques, where missing values are estimated based on available data, and omission methods, where incomplete data points are excluded from the analysis.
Data Normalization
Normalization adjusts for variations between different assay runs, ensuring data comparability across different experiments. It also corrects for non-specific binding and background noise, which can affect the accuracy of results.
Blank subtraction involves subtracting the fluorescence intensity of blank samples (containing no analyte) from all readings to correct for background fluorescence. Control normalization uses internal controls or housekeeping proteins to account for sample-to-sample variability. Standard curve adjustment employs a standard curve generated from known concentrations of the target analytes to adjust fluorescence intensities and convert them into absolute concentration values. Other normalization methods include total protein normalization, median normalization, or housekeeping gene normalization to bring the data onto a common scale.
Data Transformation
Log Transformation
Log transformation stabilizes variance and makes data more normally distributed, which is often a prerequisite for many statistical analyses. It is applied to fluorescence intensities, especially when dealing with a wide range of concentrations.
Z-Score Transformation
Z-score transformation standardizes data to a common scale, making it easier to compare across different conditions or experiments. It involves calculating the Z-score for each data point by subtracting the mean and dividing by the standard deviation of the dataset.
Statistical Methods
Descriptive Statistics
Calculation of Mean, Median, Mode: Measures of central tendency provide a summary of the dataset, indicating the typical value.
Standard Deviation, Variance: Measures of dispersion describe the variability or spread in the data, providing insights into data consistency and reliability.
Inferential Statistics
Hypothesis Testing (t-tests, ANOVA): Used to determine if there are statistically significant differences between groups.
- t-tests: Compare the means of two groups.
- ANOVA: Compare the means of three or more groups.
Correlation and Regression Analysis: Assess relationships between variables.
- Correlation: Measures the strength and direction of a relationship between two variables.
- Regression: Predicts the value of a dependent variable based on one or more independent variables.
Multiple Comparisons Correction: Adjusts for the increased risk of type I errors when performing multiple statistical tests.
- Bonferroni Correction: A conservative method that reduces the significance level based on the number of tests.
- False Discovery Rate (FDR): Controls the expected proportion of false discoveries among the rejected hypotheses.
Multivariate Analysis
Principal Component Analysis (PCA): Reduces dimensionality by transforming the data into a set of orthogonal components, highlighting patterns and clusters.
Hierarchical and k-Means Clustering: Grouping similar samples or analytes based on their fluorescence intensity profiles.
- Hierarchical Clustering: Builds a tree (dendrogram) to represent nested clusters.
- k-Means Clustering: Partitions data into k distinct clusters based on the nearest mean.
Multidimensional Scaling (MDS): Visualizes the level of similarity or dissimilarity in data, providing a spatial representation of the relationships.
Software for Data Analysis
Luminex xPONENT Software: Developed by Luminex, xPONENT offers a user-friendly interface for importing data and conducting various analysis tasks. It provides statistical tools such as curve fitting, regression analysis, and data normalization. Researchers can visualize their data using different graph types and generate customizable reports.
Bio-Plex Manager: Developed by Bio-Rad Laboratories, Bio-Plex Manager offers a comprehensive set of features, including data transformation, outlier detection, statistical testing, and advanced reporting capabilities. Researchers can generate publication-ready figures and tables using this software.
Open-Source Tools: R/Bioconductor packages provide various functions and algorithms designed for analyzing high-dimensional data. They include statistical methods and visualization tools specifically tailored to Luminex xMAP data, such as data preprocessing, normalization, quality control, and statistical analysis.
- Lumi Package: Offers functions for preprocessing, quality control, normalization, and visualization of Luminex xMAP data.
- limma Package: Useful for statistical analysis of Luminex xMAP data, providing a powerful framework for differential expression analysis, clustering analysis, and incorporation of covariates in statistical models.
Other Tools:
- FlowJo Software: Known for its capabilities in flow cytometry data analysis, FlowJo also supports the analysis of Luminex xMAP data, providing tools for data visualization, gating, and statistical analysis.
- GraphPad Prism: Widely used for scientific data analysis, GraphPad Prism supports the analysis of Luminex xMAP data and offers an intuitive interface for data import and various statistical tests.
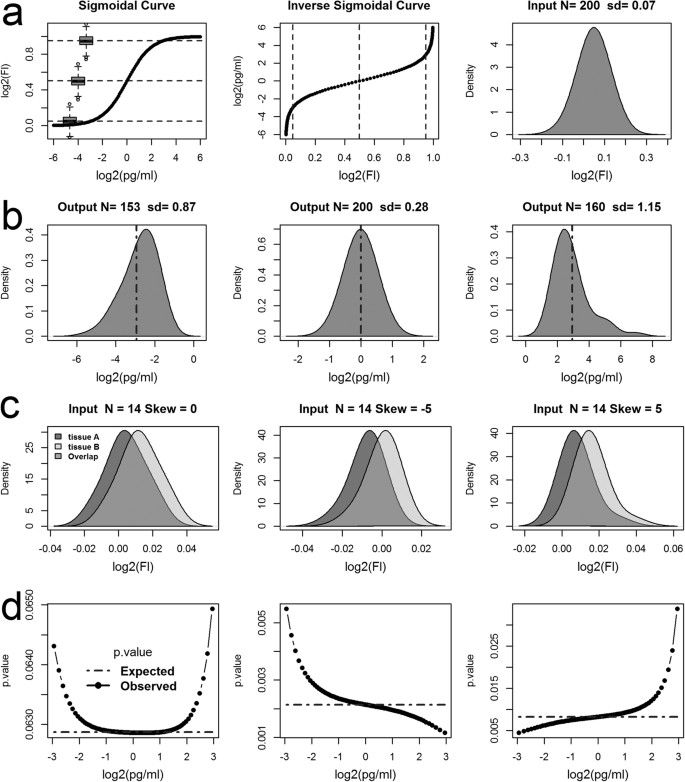 Modelling the mapping of fluorescence responses to concentration values (Breen et al., 2016).
Interpretation and Visualization
Heatmaps
Heatmaps visualize the intensity of multiple analytes across different samples, making it easy to spot patterns and correlations. They are created using normalized fluorescence intensities to display the relative abundance of analytes.
Scatter Plots
Scatter plots illustrate the relationship between two variables, such as the fluorescence intensities of two different analytes. They help identify correlations and trends within the dataset.
Box Plots
Box plots provide a visual summary of data distribution, highlighting the median, quartiles, and potential outliers. They are used to compare the distribution of fluorescence intensities across different groups or conditions.
Bar Graphs
Bar graphs display the mean fluorescence intensities of analytes, with error bars indicating variability. They present comparative data clearly and concisely, making it easier to interpret results.
Advanced Machine Learning Approaches
Supervised Learning: Techniques for classification and regression tasks, where the model is trained on labeled data.
- Classification Algorithms: Such as support vector machines (SVM), random forests, and neural networks, can classify samples based on fluorescence intensities.
- Regression Algorithms: Such as linear regression and decision trees, can predict the concentration of analytes.
Unsupervised Learning: Techniques for clustering and dimensionality reduction tasks, where the model identifies patterns without labeled data.
- Clustering Algorithms: Such as k-means and hierarchical clustering, group similar samples.
- Dimensionality Reduction: Techniques like PCA and t-SNE (t-distributed stochastic neighbor embedding) reduce data complexity while preserving significant patterns.
Bioinformatics Pipelines
- Integration with Genomic or Proteomic Data: Combining Luminex data with other omics data to provide a comprehensive view of biological systems.
- Workflow Automation for Large-Scale Data Analysis: Using scripting and automation tools to streamline data preprocessing, analysis, and reporting processes, ensuring efficiency and reproducibility.
Interpretation of Luminex Results
Identifying Positive and Negative Signals
In bead-based assays, identifying positive and negative signals is essential for accurate interpretation. Each bead in the assay corresponds to a specific analyte, and the fluorescence intensity indicates the presence and quantity of that analyte.
- Positive Signals: Positive signals are those that indicate the presence of the target analyte. These are identified by comparing the fluorescence intensity of the sample to a threshold value, typically determined by the fluorescence intensity of negative controls or blanks. A signal significantly higher than the threshold indicates a positive result.
- Negative Signals: Negative signals represent the absence or very low levels of the target analyte. These are established by using negative controls, which contain no analyte. The fluorescence intensity from these controls sets the baseline for distinguishing true analyte presence from background noise.
- Signal-to-Noise Ratio: The signal-to-noise ratio (SNR) is a crucial metric in determining the quality of the assay. A high SNR indicates a clear distinction between positive signals and background noise, enhancing the reliability of the assay results.
Quantitative vs. Qualitative Analysis
Luminex assays can be used for both quantitative and qualitative analyses, depending on the research objectives.
Quantitative Analysis: Quantitative analysis involves measuring the exact concentration of analytes in the samples. This is achieved by generating a standard curve using known concentrations of the analytes and fitting the sample data to this curve. Quantitative results are expressed in terms of concentration (e.g., pg/mL, ng/mL).
Qualitative Analysis: Qualitative analysis focuses on determining the presence or absence of analytes, rather than their exact concentrations. This type of analysis is useful for screening purposes, where the primary goal is to detect whether a particular analyte is present above a certain threshold.
Cross-Validation and Validation
Ensuring the reliability and accuracy of Luminex assay results involves rigorous cross-validation and validation processes.
Comparing Results with Known Standards
Validation of assay results requires comparing the experimental data with known standards or reference materials.
Standard Curves: A standard curve is generated using known concentrations of the target analytes. The sample data is then interpolated on this curve to determine the analyte concentrations in the unknown samples. Consistency between the measured and expected values confirms the assay's accuracy.
Spike-and-Recovery Experiments: These involve adding known quantities of analytes (spikes) to the sample matrix and measuring their recovery. High recovery rates indicate that the assay accurately quantifies the analytes in the presence of the sample matrix, validating the assay's performance.
Parallelism Tests: These tests assess whether diluted samples produce results parallel to the standard curve. Non-parallelism can indicate matrix effects or other interferences, necessitating further optimization or alternative quantification methods.
Reproducibility and Consistency Checks
Reproducibility and consistency are fundamental to the credibility of any scientific assay.
Intra-Assay Reproducibility: This measures the consistency of results within a single assay run. Multiple replicates of the same sample are tested, and the variation in their results is assessed. Low intra-assay variability indicates high precision.
Inter-Assay Reproducibility: This evaluates the consistency of results across different assay runs. Samples are tested in multiple runs, possibly by different operators or on different days, and the results are compared. High inter-assay reproducibility confirms the robustness of the assay protocol.
Quality Control Samples: Including quality control (QC) samples with known analyte concentrations in each assay run helps monitor the assay's performance over time. Consistent results for QC samples indicate stable assay conditions and reliable data.
Control Charts: Control charts track the performance of the assay over time, plotting key metrics such as mean fluorescence intensity of controls. Sudden deviations from established patterns can signal issues with assay reagents, instrumentation, or procedure, prompting timely corrective actions.
Reference:
- Breen, Edmond J., Woei Tan, and Alamgir Khan. "The statistical value of raw fluorescence signal in Luminex xMAP based multiplex immunoassays." Scientific reports 6.1 (2016): 26996.