
Why multiplex biomarker assay QC matters for study-ready data
Cohort programs live or die on whether the resulting dataset is "cohort‑usable"—that is, it demonstrates completeness (minimal missingness), comparability (across plates, days, and sites), and traceability (plate maps, lots, curve files, and decision logs that can be audited). Multiplex biomarker assay QC is the bridge between underlying biology and statistical validity: without defined acceptance criteria and pre-specified rerun rules, even beautiful immunoassay curves can produce biased cohorts and brittle endpoints.
Most translational teams operate in a research-use-only (RUO) context while still adopting bioanalytical quality-system concepts so data can withstand internal governance and partner review. To anchor the discussion, we will reference an end‑to‑end study execution flow using a cardiovascular example and an internal link to a relevant service page for context: cardiovascular disease biomarker assay.
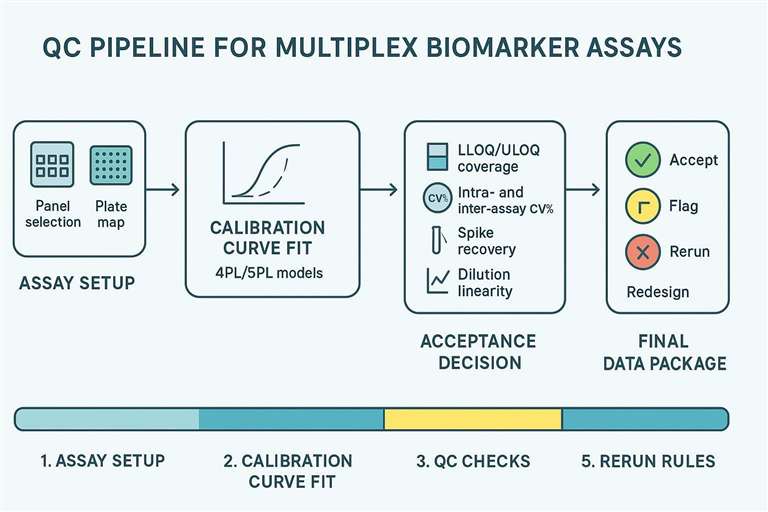 A QC pipeline from curve fitting to acceptance decisions for multiplex biomarker studies.
QC vocabulary that must be aligned before the first plate
Clear terminology prevents downstream confusion and rework. Agree on these definitions with partners, CROs, and internal statisticians before the first run.
LLOQ/ULOQ and reportable range
- Reportable range vs calibration range: The calibration (fit) range is defined by validated standards and the model (typically 4PL/5PL). The reportable range is the interval where back-calculated sample concentrations meet predefined accuracy/precision acceptance; it may be narrower than the full calibration span.
- "<LLOQ" handling: Predefine how to record and analyze results below the lower limit of quantification. Common options include assigning a constant (e.g., LLOQ/2) or treating as censored; choices affect missingness and modeling. Document the policy and apply consistently.
- ">ULOQ" handling: Values above the upper limit of quantification trigger dilution reruns according to a pre-specified rule (e.g., re-assay at MRD×k until within range). Track dilution factors and carry them into final calculations and metadata.
- For shared terminology and examples, see LLD/LLOQ/ULOQ in Luminex cytokine assays.
Note: Numerical acceptance windows presented later are example ranges; platform- and matrix-dependent.
Precision and variability language (CV%)
- Intra-assay precision refers to within-plate repeatability. Replicate wells (often duplicates) and embedded QC levels (low/medium/high) are used to compute %CV.
- Inter-assay precision captures run-to-run variability across plates, days, lots, and even sites. QC anchor samples carried across runs quantify drift and support bridging.
- Drift taxonomy helps triage: plate-to-plate drift within a day, day-to-day drift, and site-to-site variability. Each requires different corrective actions and documentation.
Accuracy and matrix performance signals
- Spike recovery evaluates whether the matrix allows accurate quantification. Typical acceptance windows in RUO multiplex work are around 80–120% (sometimes 70–130%)—example ranges; platform- and matrix-dependent.
- Dilution linearity / parallelism serves as a fit-for-purpose check: serial dilutions of neat or incurred samples should back-calculate within about ±20–30% and show slope agreement within roughly 10–20% versus the standard curve—example ranges; platform- and matrix-dependent.
- Matrix effect is the umbrella term for interference from serum/plasma components that distort apparent concentrations; it is the usual root cause behind "unexpected" results.
QC planning inputs for multiplex biomarker assay acceptance criteria
Before locking acceptance criteria, weigh study design needs and assay format realities.
Study design constraints that drive QC strictness
- Large-N cohorts vs small mechanistic studies: Large, multi-site cohorts benefit from tighter acceptance windows to protect cross-batch comparability; mechanistic pilots may tolerate wider ranges to explore biology.
- Longitudinal endpoints vs cross-sectional snapshots: Longitudinal designs prioritize stable reportable ranges and strict rerun/bridging rules to avoid artifactual trends.
- Multi-site collection and harmonization: Standardize pre-analytics (collection tubes, anticoagulant, processing time, freeze–thaw limits) and capture site identifiers to enable post hoc checks.
Assay format constraints (without turning into platform comparison)
- Panel breadth vs range coverage: Very broad multiplex panels often mix low- and high-abundance analytes, creating range pressure (clustered ULOQ). Consider split-panel strategies.
- Low-volume workflows: When volumes are constrained, platforms such as those supported by the Luminex cytokine detection service can enable duplicates/QC levels within modest sample budgets.
- Matrix-specific considerations: Serum vs plasma and anticoagulant choice affect background and recovery. For practical guidance, see serum & plasma cytokine assay.
Acceptance criteria table (QC targets that govern "usable data")
The following table translates core QC elements into what they protect, how failure looks, and what to do next. Numerical windows in downstream sections are example ranges; platform- and matrix-dependent.
| QC element | What it protects | Common failure signal | Decision outcome |
|---|---|---|---|
| Standard curve fit | Quantification validity | Non-monotonic points / poor fit | Refit / rerun |
| LLOQ coverage | Data completeness | Many values <LLOQ | Adjust panel / add sensitivity / report rule |
| ULOQ coverage | Saturation control | Many values >ULOQ | Dilute + rerun |
| Intra-assay %CV | Within-plate reliability | Replicates inconsistent | Rerun wells / exclude analyte |
| Inter-assay %CV | Across-batch comparability | Drift across plates/days | Bridge controls / rerun batch |
| Spike recovery | Matrix compatibility | Systematic under/over-recovery | Matrix mitigation / dilution rule |
| Dilution linearity | Parallelism / hook detection | Non-linear back-calculation | Split panel / adjust dilution |
| Blanks / background | Non-specific signal control | High background | Troubleshoot reagents / wash |
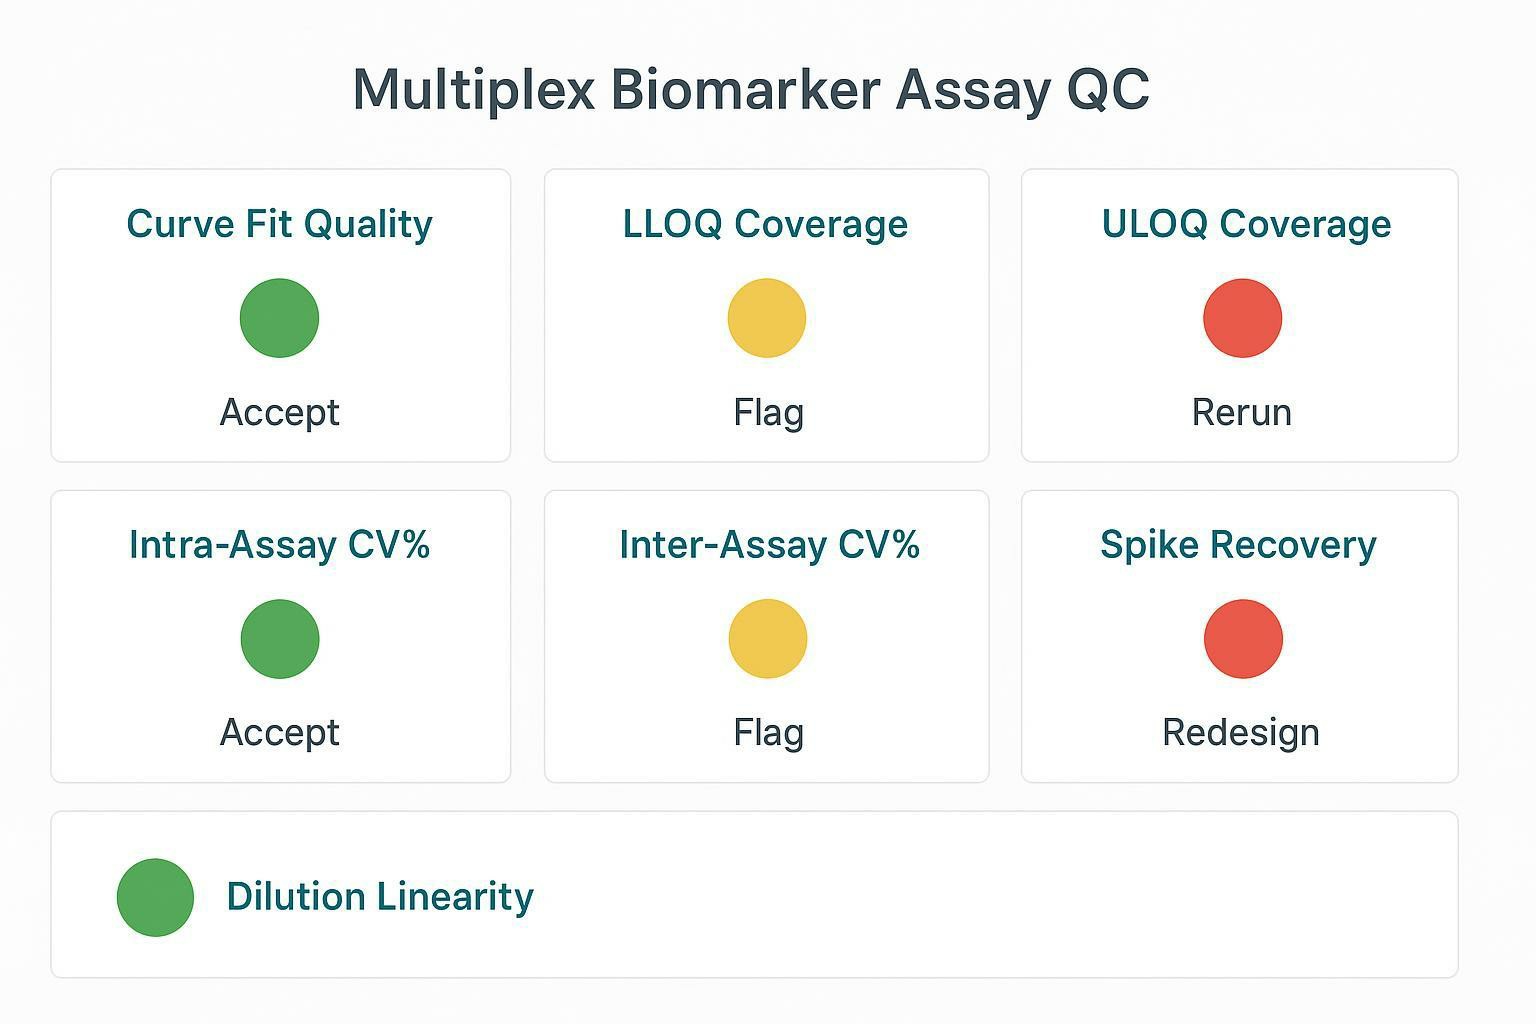 A QC dashboard translating acceptance criteria into accept/flag/rerun/redesign decisions.
Curve and calibration checks for multiplex biomarker assays
Model choice, curve construction, and residual diagnostics are the foundation of trustworthy quantification.
Standard curve integrity checks
- Calibrator preparation and mixing: Use validated stocks and consistent mixing. Small pipetting errors at high dilution factors can bend the curve.
- Curve point placement and dynamic range coverage: Ensure adequate point density in biologically relevant zones; don't over-compress near the LLOQ.
- Outlier points and refit rules: Predefine when to exclude a standard (e.g., clear non-monotonicity) and when to refit or rerun the plate. Keep an auditable log.
Back-calculation and residual logic
- Back-calculation sanity across the range: Evaluate accuracy windows for standards/QCs at LLOQ/low/mid/high. Edges typically allow wider windows than the mid-range—example practice; platform- and matrix-dependent.
- Residual patterns that indicate interference: Systematic residuals or S-shaped errors may flag matrix issues or wrong weighting.
- Edge-of-range stability: Avoid over-interpreting near the LLOQ; confirm with repeats or slight dilutions when justified.
For overarching principles on calibration and QC evaluation in ligand-binding assays, see the official guidance in FDA's Bioanalytical Method Validation Guidance for Industry (2018) and ICH guideline M10 on bioanalytical method validation (2022).
Precision control: intra-assay and inter-assay CV% in real studies
Precision is the heartbeat of cohort comparability. Separate within-plate noise from across-run drift, and assign actions to each.
Intra-assay precision (within plate)
- Replicate policy: Use duplicates for decision-critical analytes; triplicates only when justified by volume and throughput constraints.
- Plate layout for precision monitoring: Embed QC low/med/high controls to profile local variation across the plate (edge effects, wash gradients).
- Localized issues: Diagnose edge effects and pipetting artifacts by mapping replicate scatter vs plate position.
Typical targets for robust cytokines are intra-assay %CV around ≤10–15%—example ranges; platform- and matrix-dependent.
Inter-assay precision (across plates/days/lots)
- QC anchor samples: Repeat the same anchor material across runs to detect drift and support bridging.
- Lot-to-lot change control and bridging: When reagents or lots change, predefine a bridging plan with acceptance windows that, if exceeded, trigger recalibration or re-baselining.
- Drift detection and re-baselining: Track inter-assay %CV and bias vs anchors; implement re-baselining rules when excursions persist.
Inter-assay %CV targets often aim for ≤15–20% in RUO cytokine work—example ranges; platform- and matrix-dependent.
Spike recovery, dilution linearity, and matrix effect troubleshooting
Accuracy in the real matrix, not just the buffer, determines whether your cohort is decision-ready.
Spike recovery planning
- Spike levels: Cover low, mid, and high zones relevant to expected biology and the reportable range.
- Matrix-matched spiking: Use the same serum/plasma matrix type (and anticoagulant) as study samples.
- Systematic bias patterns: Under-recovery suggests suppression; over-recovery suggests matrix enhancement or calibrator mismatch.
Typical acceptable recovery windows are ~80–120% (sometimes 70–130%)—example ranges; platform- and matrix-dependent.
Dilution linearity / parallelism planning
- "Matrix stress test": Serial dilutions (e.g., neat, 1:2, 1:4, 1:8) should back-calculate within roughly ±20–30% of expectation, with slope within ~10–20% of the reference curve and R² ≥0.97–0.99—example ranges; platform- and matrix-dependent.
- Hook effect screening: Watch for paradoxically lower signal at high concentrations; treat as a trigger for predefined dilutions or a split-panel approach.
- Split-panel trigger: When low- and high-abundance analytes cannot share a single dilution to stay within LLOQ/ULOQ, split into separate dilution tracks.
Matrix effect mapping (what to test and how to respond)
- HIL (hemolysis, lipemia, icterus): Define visual or index-based flags and link to disposition rules.
- Anticoagulant effects: Heparin, EDTA, citrate can shift apparent concentrations; standardize and document.
- Pre-analytical harmonization: For a cardiovascular context and practical steps, see Serum/Plasma for Cardiovascular Biomarker Assays: Shipping Checklist.
Rerun rules and disposition: accept / flag / exclude / recollect
Pre-specify triggers to avoid post hoc bias.
Pre-specified rerun triggers
- Curve failure triggers: Non-monotonic standards, poor fit metrics, or too many standards/QCs outside acceptance.
- QC failure triggers: Intra- or inter-assay %CV beyond thresholds; anchor drift beyond limits.
- Out-of-range triggers: >ULOQ values must follow dilution-based rerun rules; "<LLOQ" reporting must follow a consistent policy with annotations for censored data.
Disposition rules for compromised samples
- Interference-driven flags: Hemolysis, lipemia, icterus with linked corrective paths (e.g., ultracentrifuge for lipemia, recollect for severe hemolysis).
- Temperature excursions and stability logic: Link shipper logs and storage records to sample disposition.
- Chain-of-custody gaps: Document and decide consistently; prefer recollection if critical.
QC deliverables and reporting package (what clients should receive)
In cohort settings, a transparent, audit-ready package is non-negotiable.
Minimum deliverables for multiplex biomarker assay QC
- Curve files and fit parameters per analyte (model, weighting, residual diagnostics).
- QC summary table with pass/flag/fail per plate and analyte, and a log of reruns.
- Sample-level flags for <LLOQ, >ULOQ, rerun, excluded, with reasons.
Study-ready metadata bundle
- Plate maps, reagent lots, run dates, operator/site identifiers.
- Bridge/anchor sample placement and results.
- Data dictionary, units harmonization, dilution factors, and calculation audit trail.
Troubleshooting decision table (fast root-cause mapping)
| Symptom | Most likely cause | Quick check | Corrective action |
|---|---|---|---|
| Many values <LLOQ | Sensitivity mismatch / degradation | LLOQ coverage report + stability notes | Increase sensitivity / tighten handling / split panel |
| Many values >ULOQ | Saturation / wrong dilution | ULOQ flags + dilution records | Dilute + rerun / revise dilution rules |
| High intra-assay CV% | Pipetting/wash artifacts | Replicate scatter + plate pattern | Retrain / recalibrate / rerun affected wells |
| High inter-assay CV% | Drift / lot change | QC anchors across runs | Bridge + recalibrate / rerun batch |
| Poor spike recovery | Matrix effect | Recovery by matrix type | Matrix-matched standards / dilution / redesign |
| Non-linear dilution | Hook effect / interference | Dilution series plot | Split panel / adjust dilutions / alternative format |
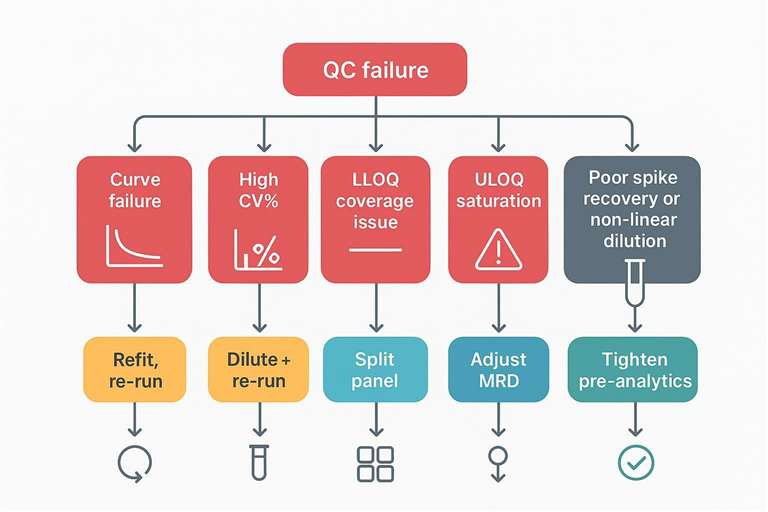 A rapid triage map from QC failure signals to corrective actions.
Related cluster articles
- Cohort decision framing (platform and scaling): How to Choose a Multiplex Cardiovascular Biomarker Assay for Cohort Studies
- Panel composition boundaries (avoid range conflicts): How to Design a Cardiovascular Biomarker Panel
FAQ
What are common acceptance criteria for multiplex immunoassay QC?
Curve fit integrity, LLOQ/ULOQ coverage, intra-/inter-assay CV%, spike recovery, and dilution linearity are typically required because they govern reportable-range validity and cohort comparability. Numeric windows shown in this guide are example ranges; platform- and matrix-dependent.
What does it mean when many results are below LLOQ?
It often signals a sensitivity mismatch, sample degradation, or matrix suppression. Mitigations include increasing assay sensitivity, tightening pre-analytics, or splitting the panel to preserve data completeness.
How do I set rerun rules for values above ULOQ in multiplex assays?
Predefine dilution-based rerun triggers (e.g., stepwise higher dilutions until within ULOQ) and apply them consistently to avoid post hoc bias that can distort longitudinal comparability.
What is matrix effect in multiplex biomarker assays?
Matrix effect refers to interference from serum/plasma components that shifts apparent concentrations. Spike recovery and dilution linearity/parallelism are practical ways to detect and manage it, with predefined acceptance criteria.
How do I control batch effects across plates and reagent lots?
Repeat QC anchor samples across runs and implement bridging controls when lots or reagents change. Lock acceptance criteria so drift is detected early and managed consistently.
Do I need spike recovery and dilution linearity for every analyte?
Prioritize analytes with known matrix sensitivity or range pressure. These tests predict missingness, saturation, and interpretability in real samples and help set split-panel or dilution strategies.
References:
- ICH. ICH guideline M10 on bioanalytical method validation and study sample analysis. 2022. Official Step 5 PDF (EMA host).
- U.S. Food and Drug Administration. Bioanalytical Method Validation Guidance for Industry. 2018. FDA guidance PDF.
- Khan SS, Smith MS, Reda D, et al. Multisite comparison of high-sensitivity multiplex cytokine assays. Clinical and Vaccine Immunology. 2012;19(4):547–556. .
- de Jager W, te Velthuis H, Prakken BJ, Kuis W, Rijkers GT. Development, validation and implementation of a multiplex immunoassay for cytokine measurement in biological fluids. Clinical Biochemistry. 2005;38(6):536–542..