
Blood-based monitoring has never been the whole story in Crohn's disease, but it remains a practical way to capture inflammatory biology between invasive assessments. This guide takes a translational perspective on blood biomarkers in Crohn's disease—focusing on what to measure in multi-analyte panels, when these panels are most useful, and how to interpret pattern-level results in context. The emphasis is on mechanistic and fit-for-purpose research applications, with secondary attention to longitudinal tracking in preclinical through Phase II settings.
Why Multi-Analyte Panels Matter for Disease Monitoring
The limitations of symptom-based tracking
Symptoms fluctuate for reasons that don't always mirror mucosal inflammation. Pain, fatigue, and stool frequency can lag behind (or overshoot) the underlying inflammatory burden, and placebo or contextual effects blur interpretation. Relying on symptoms alone risks missing smoldering inflammation that continues to drive long-term complications.
The limitations of relying on a single blood marker
A single analyte—CRP is the classic example—can be informative, but it reflects systemic inflammation more than gut-specific activity. Inter-patient variability, genotype, prior therapy, and extraintestinal processes all influence a marker's baseline and dynamics. One number rarely captures the biology you need for translational decision-making.
The rationale for a panel-based approach
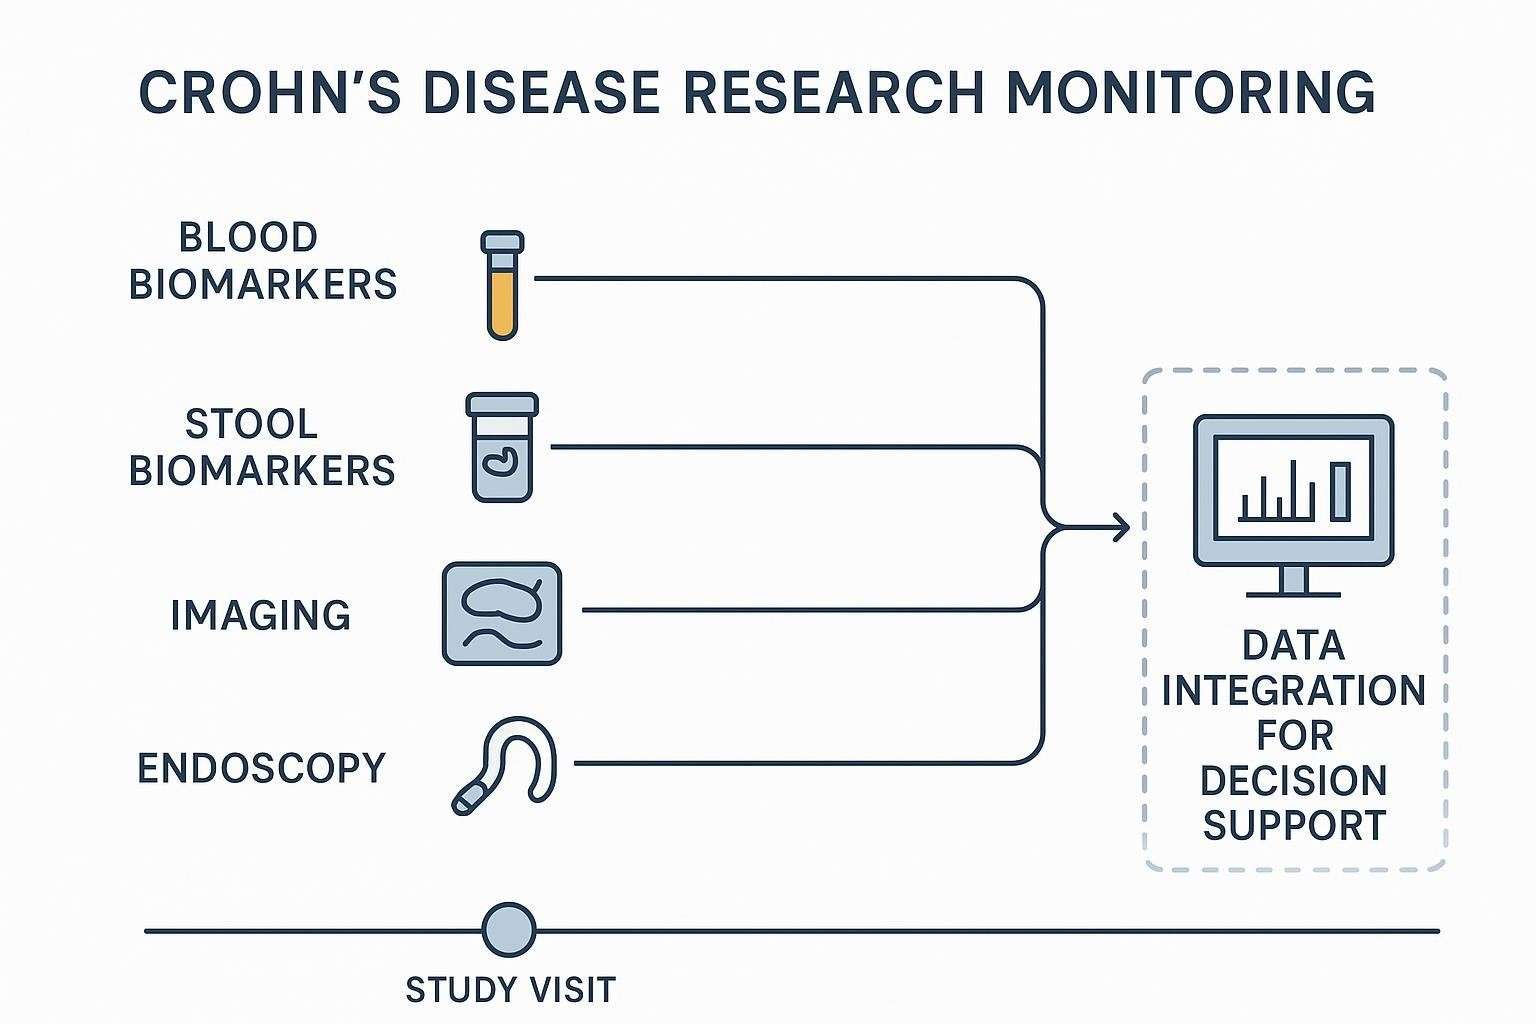
Inflammation in Crohn's is networked. Multi-analyte panels let you observe coordinated pathway activity (e.g., Th1/Th17, innate acute-phase, chemotaxis) instead of chasing isolated outliers. Reading changes across cytokines, chemokines, and related proteins can yield a more resilient longitudinal signal—especially when integrated with stool biomarkers, imaging, and endoscopy.
What to Measure in Blood-Based Multi-Analyte Panels
Translational programs benefit from building panels around pathways you expect to move—and that your platform can measure reliably across time.
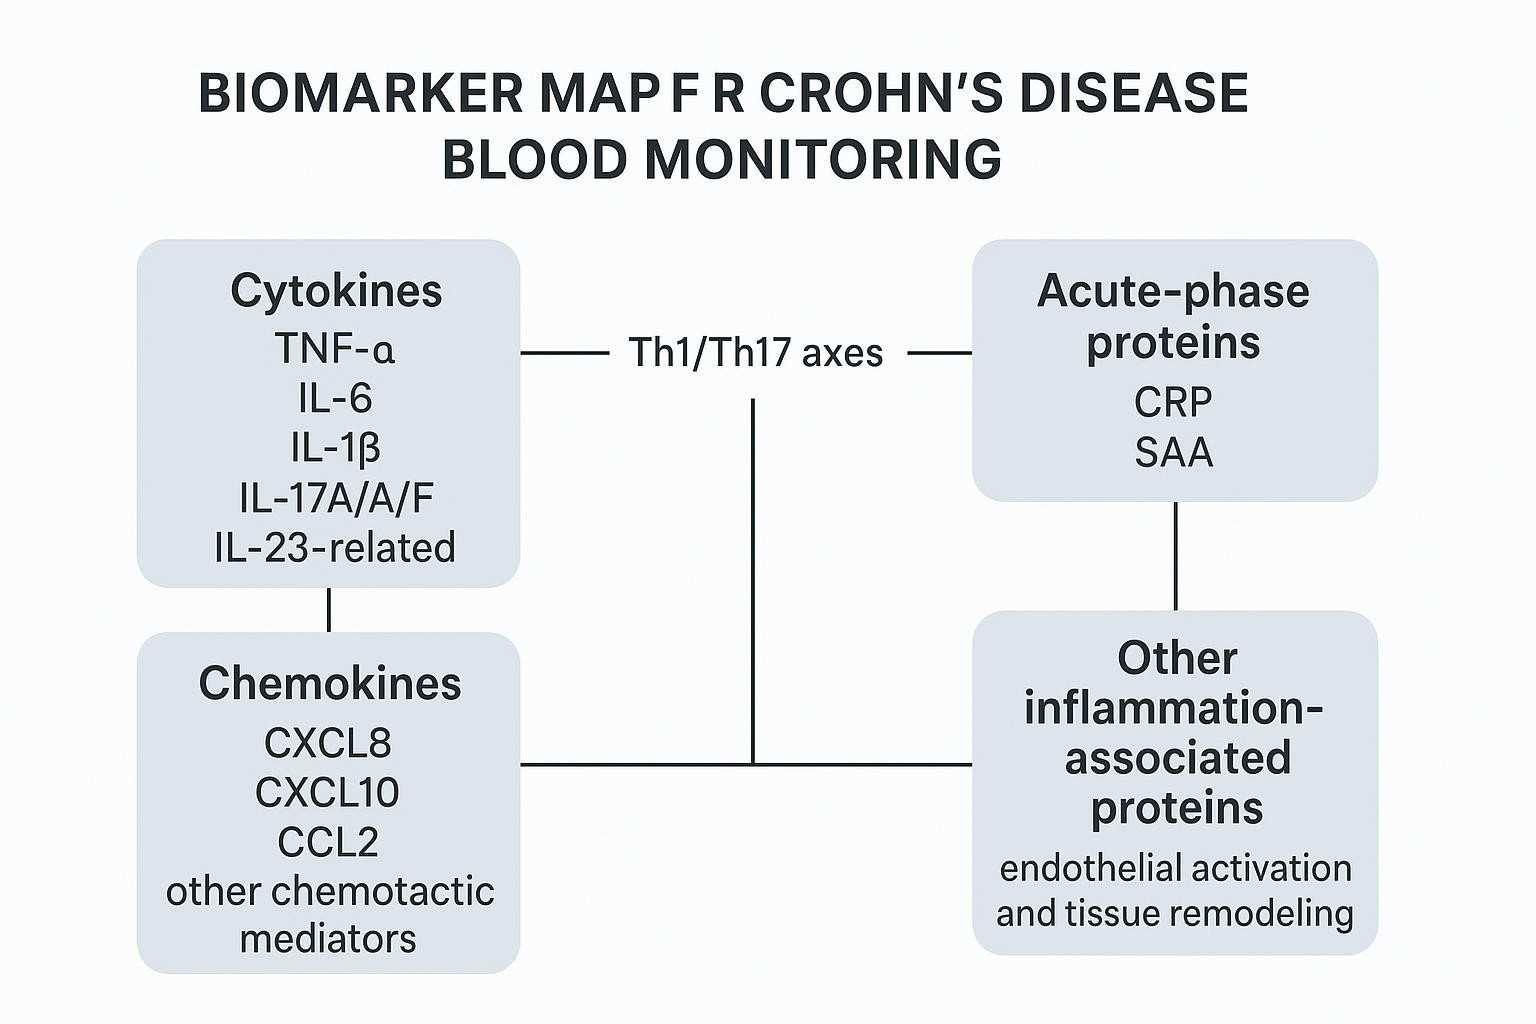
Core pro-inflammatory cytokines
Focus on canonical mediators with strong mechanistic rationale and practical detectability in serum/plasma:
- TNF-α
- IL-6
- IL-1β
- IL-17-related markers (e.g., IL-17A/F)
- IL-23 pathway-associated markers (e.g., p19-related readouts, IL-23/IL-12 family context)
When you need broad coverage with modest sample volume, Luminex xMAP-based offerings can help scope feasible panels; see the platform-oriented overview in the Luminex Multiplex Cytokine Panel Service and human-focused targets via the Human Cytokine Panel Service .
Chemokines linked to immune-cell recruitment
Leukocyte trafficking is central to intestinal inflammation. Consider including:
- CXCL8 (IL-8)
- CXCL10 (IP-10)
- CCL2 (MCP-1)
- Additional chemotactic mediators tied to Th1/Th17 recruitment and monocyte trafficking
For practical lists of human chemokine targets and panel options, refer to the Human Chemokine Panel Service .
Inflammation-associated proteins beyond classic cytokines
Panels often benefit from markers that integrate upstream signals:
- Acute-phase proteins (e.g., CRP, SAA)
- Immune-regulatory proteins (e.g., IL-10, regulatory ligands if measurable)
- Tissue remodeling or endothelial activation markers (platform- and cohort-dependent)
These can contextualize whether a cytokine/chemokine pattern is translating into systemic response or vascular/tissue signaling.
How panel composition should be matched to the study goal
- Broad discovery-oriented panels: cast a wide net early; expect to refine later.
- Focused longitudinal monitoring panels: fewer, trendable analytes with strong precision and stable detectability.
- Therapy-response tracking panels: enrich for pathways proximal to the mechanism of action (e.g., IL-23/Th17 axes for anti-IL-23 programs).
- Custom panels for translational or mechanism-driven studies: prioritize analytes with proven detectability, acceptable precision, and parallelism in your matrix.
Which Blood Biomarkers in Crohn's Disease Are Most Useful for Monitoring Inflammatory Activity
Markers associated with systemic inflammatory burden
Acute-phase proteins (CRP, SAA) and cytokines such as IL-6 often increase with systemic inflammation. Their value is in confirming directionality—especially when combined with chemotaxis signals (e.g., CXCL10) that indicate immune recruitment. The limitation is specificity: systemic signals can be driven by intercurrent infections, extraintestinal inflammation, or even sample-handling artifacts.
Markers that may better reflect intestinal inflammatory activity
Serum candidates reported across cohorts include IL-6 and IP-10 among others, but cross-study reproducibility remains mixed. The take-home: use combinations and trends, not single thresholds, and validate against your cohort's endoscopic or fecal calprotectin anchors before leaning on conclusions.
Markers relevant to treatment-response monitoring
Pathways proximal to a drug's target can show early shifts after induction or optimization. For example, in IL-23 pathway inhibition, coordinated down-trending across IL-23/Th17-related signals plus acute-phase attenuation can suggest on-pathway effects. Distinguish those patterns from broad inflammatory noise by requiring replicated, time-ordered changes across multiple analytes.
Promising markers that still require stronger validation
Many cytokines/chemokines recur in small or single-center studies but fall short on external validation and standardization. Treat them as exploratory until you've confirmed detectability, precision, and correlation with independent endpoints in your matrix and platform.
When Blood-Based Multi-Analyte Panels Are Most Useful
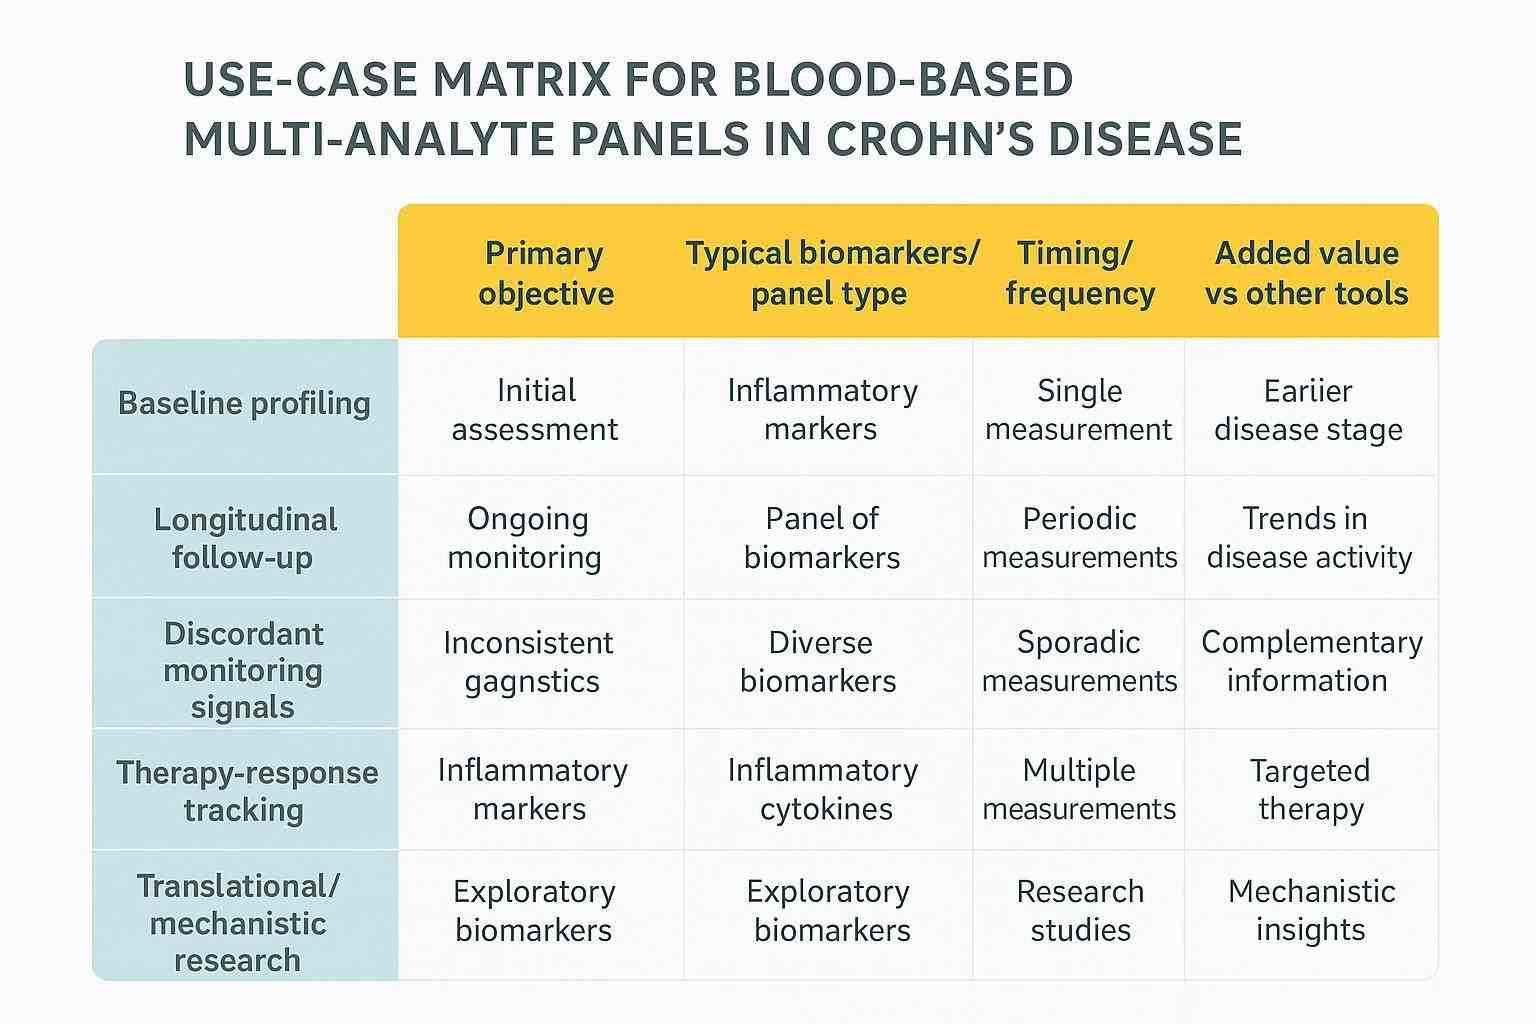
Baseline inflammatory profiling before longitudinal follow-up
Establish a personalized inflammatory fingerprint at time zero. Identify which analytes are robustly detected and stable enough to trend, and set expectations for dynamic range and variability.
Interval monitoring during follow-up
Between endoscopy or imaging milestones, repeated blood sampling can reveal directionality—e.g., steady decline across acute-phase and chemotaxis clusters that supports a broader picture of improvement.
Cases with discordant monitoring signals
When symptoms, fecal calprotectin, CRP, and imaging/endoscopy don't align, panel-level blood data can add systemic immune context. Use it to generate hypotheses and guide when to escalate confirmatory testing—not to overrule direct readouts.
Monitoring during biologic or targeted therapy
After starting or optimizing therapy, look for coordinated shifts in on-pathway cytokines/chemokines and integrators like SAA/CRP. Time those reads to pharmacology (e.g., post-dose windows) and track against stool and imaging.
Research and translational use cases
Panels shine in mechanism-of-action studies, candidate biomarker refinement, and assay development—especially for selecting durable, trendable markers and optimizing longitudinal QC.
How to Interpret Multi-Analyte Panel Results
Start with the monitoring objective
Be explicit: are you trending longitudinal change, stratifying inflammatory phenotypes, or exploring treatment-response patterns? Interpretation depends on the intended question.
Read the panel as a pattern rather than a single value
Ask whether related pathways move together. For example, do IL-6/SAA and CXCL10 decline in parallel? Cohesive pathway movement is more convincing than a lone cytokine spike.
Prioritize trends over one-time snapshots
One-off elevations are noisy. Repeated, time-ordered measurements reduce ambiguity, especially when aligned to dosing and standardized sample handling.
Interpret results in the context of other monitoring inputs
Panel signals gain meaning alongside CRP, fecal calprotectin, imaging, and endoscopy. FC is particularly gut-specific and often guides non-invasive decisions, while CRP reflects systemic activity; both can frame what you see in serum cytokines/chemokines. Contemporary guidance emphasizes multimodal monitoring that can sometimes defer immediate endoscopy when CRP and FC are low—see summaries of ACG/AGA principles in Evidence-Based GI and StatPearls for context: ACG update overview by Zhai & Dalal (2025) and the StatPearls Crohn Disease chapter (2024 update).
Recognize common confounders
- Intercurrent infection (viral/bacterial)
- Extraintestinal inflammation (e.g., arthritis, skin involvement)
- Concomitant medications (steroids, immunomodulators)
- Non-disease inflammatory signals (e.g., vaccination windows)
How Blood-Based Panels Compare With Other Monitoring Tools
Compared with CRP
CRP is inexpensive, accessible, and useful for systemic inflammation. It's less specific to gut activity and can be normal in active mucosal disease. Multi-analyte panels add biological nuance by showing whether upstream cytokines and chemokines are coordinated, but they should complement—not replace—CRP.
Compared with fecal calprotectin
Fecal calprotectin (FC) is among the best non-invasive markers for intestinal inflammation and often correlates with endoscopic activity. Blood-based panels offer practical advantages when stool collection is challenging, when you need pathway-level signals, or when integrating with pharmacodynamic timelines, but FC remains a cornerstone for gut-specific readouts.
Compared with endoscopic and imaging follow-up
Endoscopy and cross-sectional imaging provide direct/indirect assessments of mucosal disease. Blood-based panels are adjunctive—most valuable between invasive assessments and for mechanistic insights.
Why integrated monitoring strategies are often more informative
A multimodal framework—CRP, FC, imaging/endoscopy, plus panel-level blood biomarkers—helps separate true biological change from noise and reduces the risk of over-interpreting any single signal.
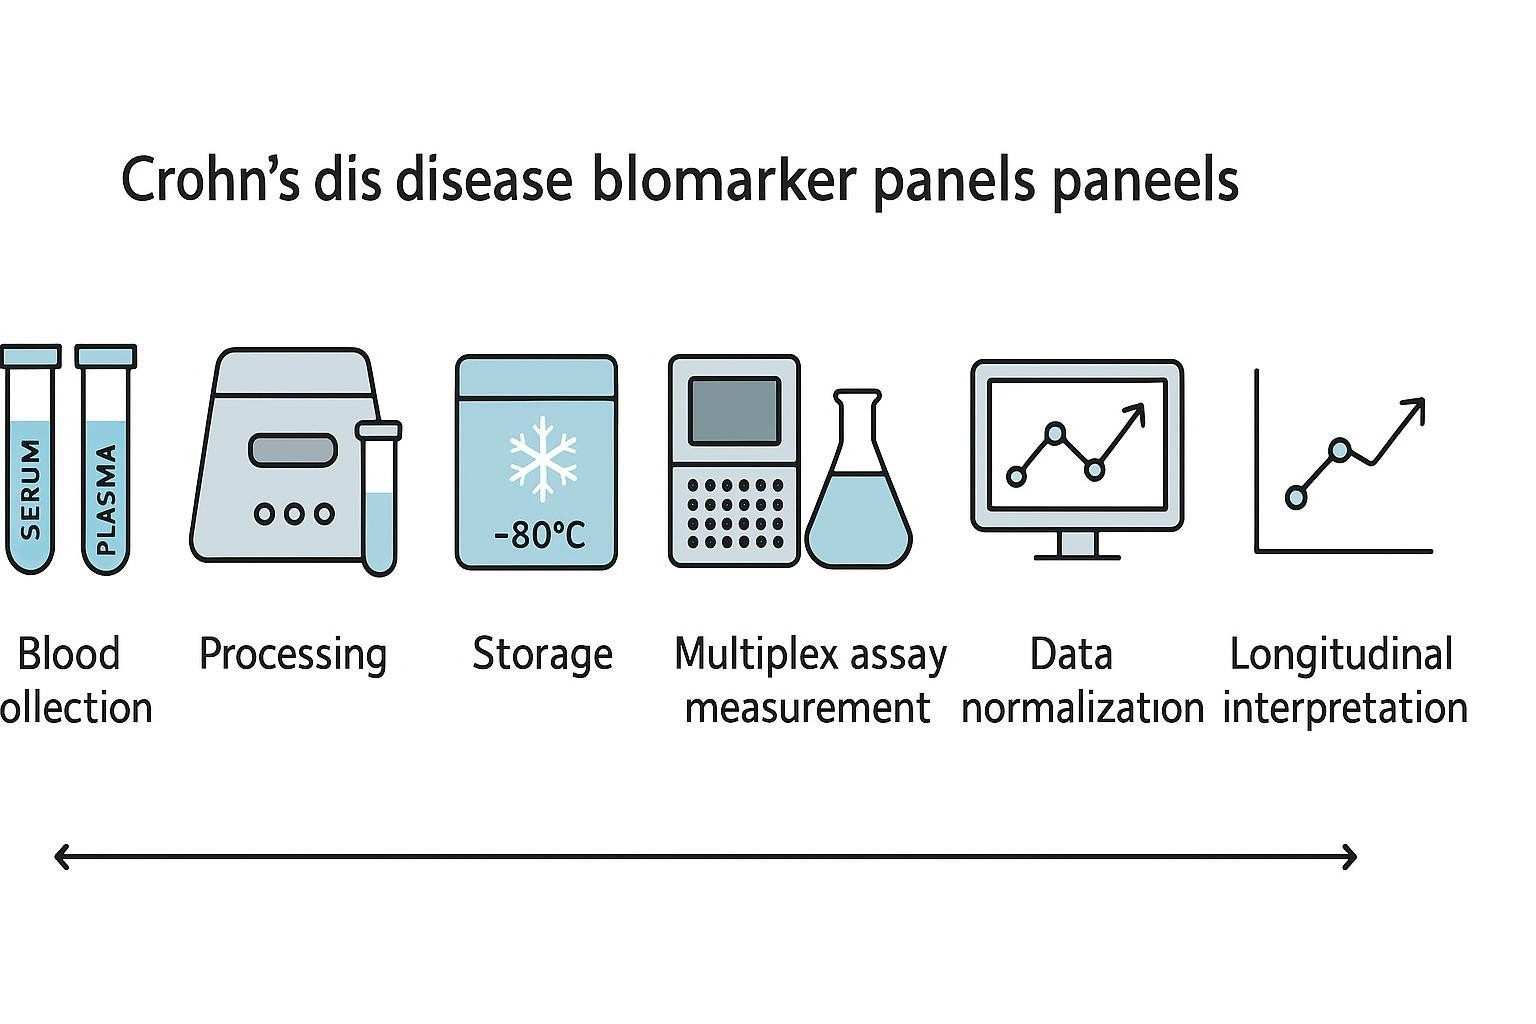
Analytical and Workflow Considerations
Analytical rigor is what makes panel data interpretable. Think sample type, platform behavior, and harmonized QC before you think "biomarker discovery." If you don't control pre-analytics and validation, your trends will lie to you.
Sample type and collection variables
- Serum versus plasma: Many cytokines differ between matrices due to ex vivo release; EDTA plasma can reduce artifactual elevations for select analytes. See methodology syntheses such as Verberk et al. (2021) for pre-analytical effects: Pre-analytical handling and cytokines.
- Timing of collection: Align to dosing/diurnal windows; standardize fasting and circadian factors where feasible.
- Processing and storage: Rapid centrifugation, aliquoting, storage at −80°C, and limited freeze–thaw cycles (≤1–2) are typical guardrails.
Assay platform considerations
Two workhorse platforms for serum protein multiplexing are bead-based fluorescence (Luminex xMAP) and planar electrochemiluminescence (MSD). Comparative analyses highlight analyte- and matrix-dependent differences in sensitivity, dynamic range, and precision—see Khan et al. (2020): Bead vs ECL multiplex comparison.
- Luminex xMAP: broad multiplex breadth (dozens to ~100 analytes/well), efficient sample use, strong for discovery-oriented profiling; guard against cross-reactivity in dense plexes.
- MSD ECL: often lower LLOQs for select targets and strong precision; excellent for focused panels and low-abundance readouts; multiplex breadth per plate is smaller than Luminex.
For practical platform capabilities and options, see the Luminex xMAP Cytokine Detection Service .
Reproducibility and standardization
- Inter-laboratory variability: Avoid platform switching mid-study; if unavoidable, run cross-validation and bridging.
- Batch effects: Use pooled QC and anchor samples on each plate/run; monitor drift and apply pre-specified normalization.
- Quality control: Define within- and between-run precision targets (e.g., ≤15% CV, ≤20% at LLOQ) and acceptance rules analyte-by-analyte.
Why analytical rigor shapes interpretability
Longitudinal interpretation requires the same workflows across timepoints. Align SOPs, reagents, lots, and data processing. Validate in your actual matrix (serum vs plasma) and disease state, and document parallelism to ensure dilution-based quantification reflects true concentrations.
Platform trade-offs and validation checkpoints at a glance:
| Attribute | Luminex xMAP (bead fluorescence) | MSD ECL (electrochemiluminescence) |
|---|---|---|
| Typical multiplex breadth | High (dozens to ~100 analytes/well) | Moderate (panel-dependent) |
| Sensitivity/LLOQ | Analyte- and kit-dependent; pg/mL range common | Often lower LLOQs for select cytokines (analyte-dependent) |
| Dynamic range | Broad; ULOQ can be high for many targets | Broad; strong linearity in mid-range |
| Sample volume | Low (tens of µL per well typical) | Low-to-moderate depending on panel |
| Cross-reactivity risk | Higher with dense plexes; design matters | Lower in focused panels |
| Best-fit use case | Discovery/breadth, trendable monitoring | Focused panels, low-abundance targets |
| Key caution | Avoid over-plexing; confirm specificity | Multiplex size limits; per-panel coverage |
| Comparative note | Do not mix platforms within a longitudinal series; if required, bridge rigorously (cross-validation) | Same |
Fit-for-purpose validation checklist (apply analyte-by-analyte):
| Validation element | Recommended practices (fit-for-purpose) |
|---|---|
| LOD/LOQ determination | Define per platform guidance; confirm at low end with acceptable precision/accuracy (e.g., ±20% at LLOQ) per ICH M10. |
| Precision (%CV) | Within- and between-run ≤15% (≤20% at LLOQ); monitor pooled QC across plates. |
| Accuracy/Recovery | Spike-recovery ~80–120%; investigate outliers and matrix effects. |
| Parallelism/Dilution linearity | Demonstrate slopes comparable to standards across dilutions in disease-state matrices. |
| Matrix effects | Test multiple matrix lots (e.g., ≥6) and anticoagulants; document interference and mitigation. |
| Stability | Assess freeze–thaw tolerance and storage stability (−80°C) under study conditions. |
| Cross-batch comparability | Use anchor samples and bridging runs; pre-specify normalization rules. |
| Documentation | Align with ICH M10 bioanalytical validation and fit-for-purpose guidance such as Jani et al., 2015. |
Pre-analytics quick-guide (serum cytokines/chemokines):
| Variable | Recommendation |
|---|---|
| Matrix | Choose serum vs EDTA plasma based on target behavior; validate both if uncertain. |
| Collection timing | Standardize relative to dosing, meals, circadian rhythms. |
| Processing | Prompt centrifugation and aliquoting; minimize processing lag. |
| Storage | −80°C; track location and time; cap freeze–thaw cycles (≤1–2). |
| Hemolysis/lipemia | Record and, if possible, exclude or flag for sensitivity analyses. |
Common Pitfalls in Panel Design and Interpretation
Over-relying on exploratory markers
Discovery-stage hits are tempting, but many don't replicate or lack robust detectability. Prioritize markers with biological plausibility, platform detectability, and acceptable precision/parallelism in your matrix.
Treating all elevations as equally meaningful
A twofold rise in CXCL10 isn't equivalent to a twofold rise in IL-6. Consider pathway context, baseline variability, and specificity before drawing conclusions.
Ignoring disease heterogeneity
Location (ileal vs colonic), behavior (inflammatory vs stricturing), and prior therapy shift cytokine baselines and dynamics. Don't overgeneralize across phenotypes.
Overlooking technical sources of variation
Pre-analytics, platform-specific behavior, and batch effects can mimic biology. If QC charts look jarring, pause interpretation until you resolve the technical signal.
How to Build a More Useful Monitoring Framework
Define the intended monitoring question first
Be crisp about whether you're doing longitudinal tracking, treatment-response exploration, stratified profiling, or translational panel development. That decision drives panel size, platform, and QC depth.
Select analytes with clear biological and technical rationale
Tie each marker to a pathway hypothesis, confirm detectability/precision/parallelism, and ensure ranges that can be trended without frequent imputation.
Align panel design with longitudinal interpretability
Favor markers with stable baselines and durable dynamic ranges across visits. Predefine how you'll normalize and handle missingness or values below LLOQ.
Integrate panel data into a broader monitoring framework
Plan from day one to read blood biomarker panels alongside FC, CRP, imaging, and endoscopy. Think of the panel as a lens that clarifies pathway dynamics, not as a standalone decision engine.
Frequently Asked Questions
What types of biomarkers are commonly included in Crohn's disease blood-based panels?
Short answer: Cytokines (e.g., TNF-α, IL-6, IL-1β, IL-17/IL-23 axis), chemokines (CXCL8, CXCL10, CCL2), acute-phase proteins (CRP, SAA), and select inflammation-associated proteins (e.g., endothelial or tissue-remodeling markers). Evidence note: These categories map to core inflammatory pathways implicated in IBD and are technically measurable on common multiplex platforms, with detectability and precision varying by analyte and matrix.
When are blood-based multi-analyte panels most informative?
Short answer: For baseline profiling, interval longitudinal follow-up, therapy-response patterning, and discordant-monitoring scenarios. Evidence note: Panels are complementary to stool biomarkers (especially fecal calprotectin) and imaging/endoscopy; contemporary guidance encourages multimodal monitoring when possible (see ACG/AGA summaries cited above).
Are broader panels always better?
Short answer: No. Panel size should match the monitoring purpose. Broad panels are ideal for discovery; focused, validated panels are better for longitudinal trending. Evidence note: Over-plexing raises cross-reactivity risk and reduces interpretability; fit-for-purpose validation per analyte is recommended by bioanalytical guidance such as ICH M10.
What makes a panel result more interpretable over time?
Short answer: Consistent sampling and pre-analytics, technically robust assays (precision, recovery, parallelism), emphasis on longitudinal trends, and integration with CRP/FC/imaging/endoscopy. Evidence note: Methodology literature shows pre-analytical handling and platform differences can materially alter cytokine results; robust QC and normalization are prerequisites for interpretation.
References:
- Zhai L, Dalal R. Updated 2025 ACG clinical guideline for the management of Crohn's disease in adults. Evidence-Based GI (ACG). 2025. https://gi.org/journals-publications/ebgi/zhai_dalal_sep2025/
- Lichtenstein GR, Loftus EV Jr, Isaacs KL, et al. ACG Clinical Guideline: Management of Crohn's Disease in Adults. PubMed record. 2025. https://pubmed.ncbi.nlm.nih.gov/40701562/
- StatPearls. Crohn Disease. Updated 2024. https://www.ncbi.nlm.nih.gov/books/NBK436021/
- Verberk IMW, Slot RE, Verfaillie SCJ, et al. Pre-analytical sample handling effects on blood cytokine levels. Cytokine. 2021. https://pmc.ncbi.nlm.nih.gov/articles/PMC8359910/
- Khan SS, Smith MS, Reda D, et al. Comparison of bead-based fluorescence versus planar electrochemiluminescence multiplex immunoassays. Cytokine. 2020. https://pmc.ncbi.nlm.nih.gov/articles/PMC7546899/
- European Medicines Agency. ICH M10: Bioanalytical Method Validation (Step 5). 2023. https://www.ema.europa.eu/en/documents/scientific-guideline/ich-guideline-m10-bioanalytical-method-validation-step-5_en.pdf
- Jani D, Allinson J, Berisha F, et al. Recommendations for Use and Fit-for-Purpose Validation of Biomarker Multiplex Ligand Binding Assays. AAPS J. 2015. https://pmc.ncbi.nlm.nih.gov/articles/PMC4706274/
- Nature Communications. Plasma proteomic profiles identify biomarkers predicting Crohn's disease. 2025. https://www.nature.com/articles/s41467-025-66483-4
- Scientific Reports. Non-invasive determination of disease activity in Crohn's disease by serum Luminex profiling. 2026. https://www.nature.com/articles/s41598-026-42925-x