
Who This Resource Is For
Typical study scenarios
- Human serum or plasma cytokine studies with low-abundance analytes and uneven detectability
- Translational biomarker projects where not all markers are expected to be reportable across all samples
- Multi-batch multiplex studies that need consistent data inclusion and exclusion rules
- Teams preparing reports for internal decision-making, external collaborators, or audit-sensitive review
Key questions addressed on this page
- What should happen when cytokine values fall below LLOQ or above ULOQ?
- How should missing values be classified, handled, and reported in multiplex cytokine datasets?
- When should QC filtering be applied, and what should trigger exclusion, rerun, or qualification?
- How can a predefined data policy improve comparability, transparency, and interpretability?
Why a Data Policy Matters in Multiplex Cytokine Studies
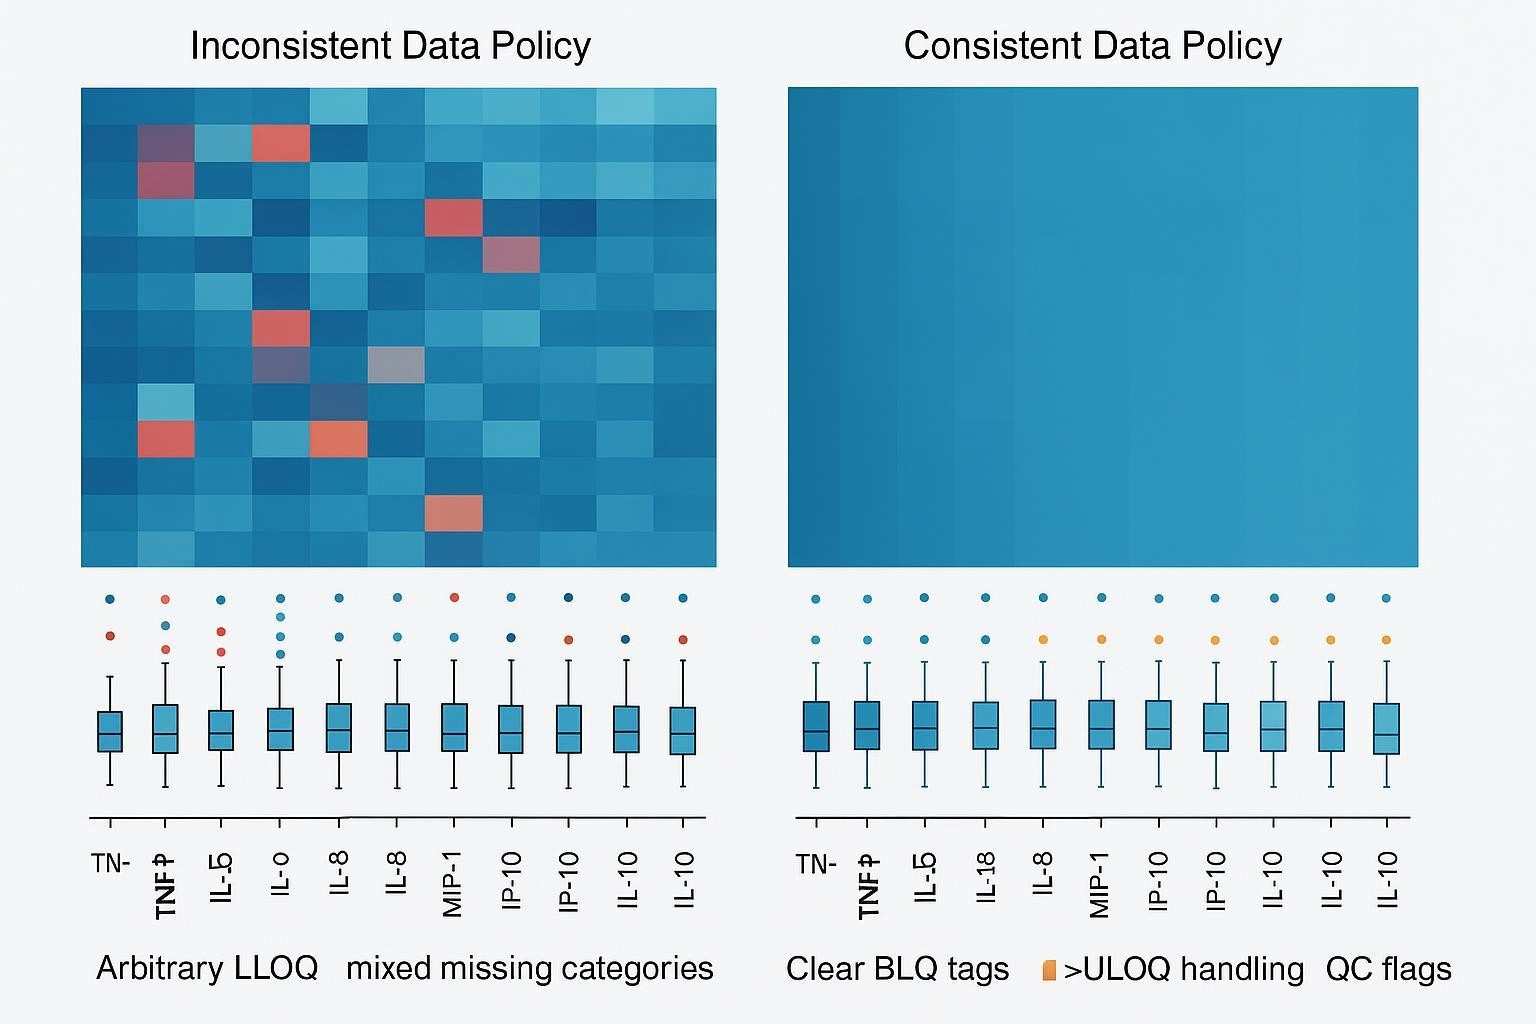
In multiplex cytokine studies, data handling is not just a downstream formatting step. It directly shapes how results are interpreted. Within the same panel, some analytes remain robust and broadly quantifiable, while others sit near the lower limit of quantification, drift toward saturation, or become intermittently non-reportable because of matrix effects, assay variability, or sample-specific constraints. That means decisions about BLQ values, missingness, and QC filtering can materially change tables, plots, statistics, and even the biological story a dataset appears to support.
The risk increases when those decisions are made only after the results are visible. If rules for <LLOQ, >ULOQ, technical failures, reruns, or exclusions are handled ad hoc, the same dataset may look more or less convincing depending on who reviewed it and why. In translational and multi-batch projects, that inconsistency weakens comparability, complicates reporting, and makes it easier for downstream users to overinterpret values that were never truly fit for quantitative use.
A predefined data policy helps prevent that drift in interpretation. In Luminex-based workflows especially, multiplex breadth is a major strength, but it also makes below-range values, non-reportable points, and analyte-specific QC issues a normal part of the dataset rather than an exception. A strong policy does not remove those limitations; it makes them visible, classifiable, and manageable so final outputs remain interpretable, auditable, and aligned with the real quality of the data.
What Below LLOQ Really Means
A result below the lower limit of quantification does not mean the analyte is absent. It means the assay detected a signal that cannot be quantified with enough confidence under the defined conditions.
In multiplex cytokine studies, that distinction matters because low-end values can come from very different sources. A BLQ result may reflect true biological scarcity, but it can also be shaped by matrix effects, dilution choices that reduce sensitivity, or analyte-specific assay limitations. That is why <LLOQ should be treated as a distinct result state, not collapsed automatically into zero or into technical failure.
Why this matters
- BLQ is not the same as zero
Reporting all below-range values as zero can distort distributions and exaggerate biological absence. - BLQ is not the same as assay failure
A low-end censored value should be separated from technical problems such as failed acquisition, poor bead recovery, or unstable curve performance. - BLQ must be interpreted in context
Frequent BLQ values may be expected for some exploratory or baseline markers, but the same pattern may be unacceptable for a decision-critical analyte.
A practical principle
A defensible data policy keeps BLQ visible as its own category. This makes low-end censoring easier to track, preserves the boundary between descriptive detection and quantitative reporting, and helps downstream tables, figures, and models reflect what the assay truly supports rather than what a spreadsheet default makes convenient.
Beyond Below LLOQ: Other Non-Reportable Result Types
Above ULOQ or upper-range saturation
- Some cytokines may exceed the reportable range under the selected dilution
- High-end censoring should be handled through predefined rerun or qualification rules
- Above-range results should not be mixed indiscriminately with quantified values. Dilution back into range with verification of linearity and assessment of potential hook effects is standard best practice, aligning with regulated LBA guidance and immunoassay method literature (FDA BMV, 2018; hook-effect overview, 2017: PMC5556679).
Missing by acquisition or technical failure
- Low bead count, poor acquisition, curve instability, or plate-level failure may create non-reportable outputs
- These are not equivalent to biologically low values and should be classified separately. Vendor recommendations for Luminex often target ≥50 beads per region (≥35 minimum) to maintain stability of median fluorescence intensity; operation below these levels can compromise reportability (MILLIPLEX data analysis guidance).
Missing by study design or sample limitation
- Insufficient sample volume
- No rerun reserve
- Planned omission for selected analytes or subsets
- These should be tracked distinctly from assay failure
Descriptive-only values
- Some values may be useful for pattern recognition but not appropriate for decision-grade reporting
- A transparent policy should separate descriptive outputs from quantitatively reportable results
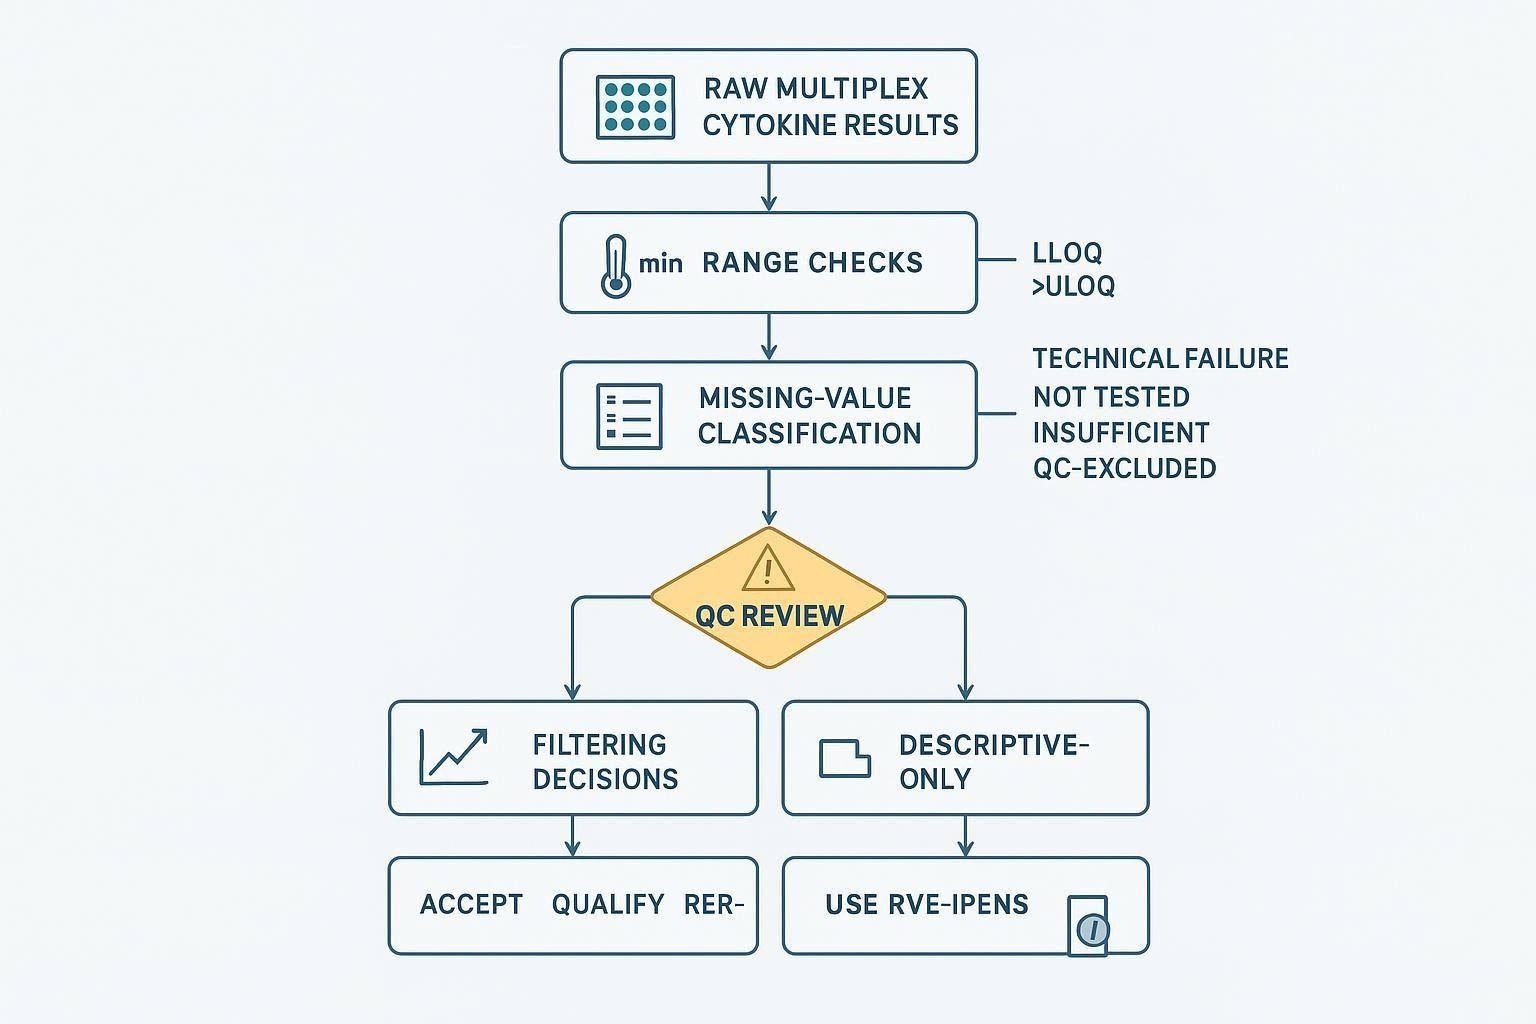
How to Classify Missing Values Before Analysis
In multiplex cytokine datasets, “missing” is rarely a single condition. A value may be below the quantifiable range, above the usable range, technically invalid, not tested by design, or unavailable because the sample was insufficient. These states can look similar once the data reach a spreadsheet or analysis file, but they do not mean the same thing scientifically, and they should not be handled as if they do.
That is why missing-value classification should happen before statistics, visualization, or downstream filtering begins. If different types of non-reportable results are merged too early, biologically low values can be confused with technical failures, and planned omissions can be mistaken for assay weakness. Once that distinction is lost, tables become harder to annotate correctly, QC review becomes less transparent, and model inputs start to mix fundamentally different forms of uncertainty.
A practical classification framework should separate at least six result states: quantifiable/reportable, BLQ (<LLOQ), >ULOQ, technical failure, not assessed, and QC-excluded or sample-insufficient. The exact labels may vary by workflow, but the principle is the same: each state should correspond to a different reporting meaning and, where relevant, a different modeling consequence. A BLQ result may remain visible as censored data; a technical failure may need to be excluded from quantitative analysis; a not-tested sample should remain traceable as an execution outcome rather than an assay signal problem.
For implementation, it helps to make the classification matrix explicit in the study plan rather than leaving it to analyst judgment after data review. That way, when the same analyte appears as quantified in some samples, BLQ in others, and technically invalid in a small subset, the dataset still supports a consistent reporting language. This is especially important in multi-batch or collaborator-facing projects, where clarity about why a value is absent often matters as much as the value itself.
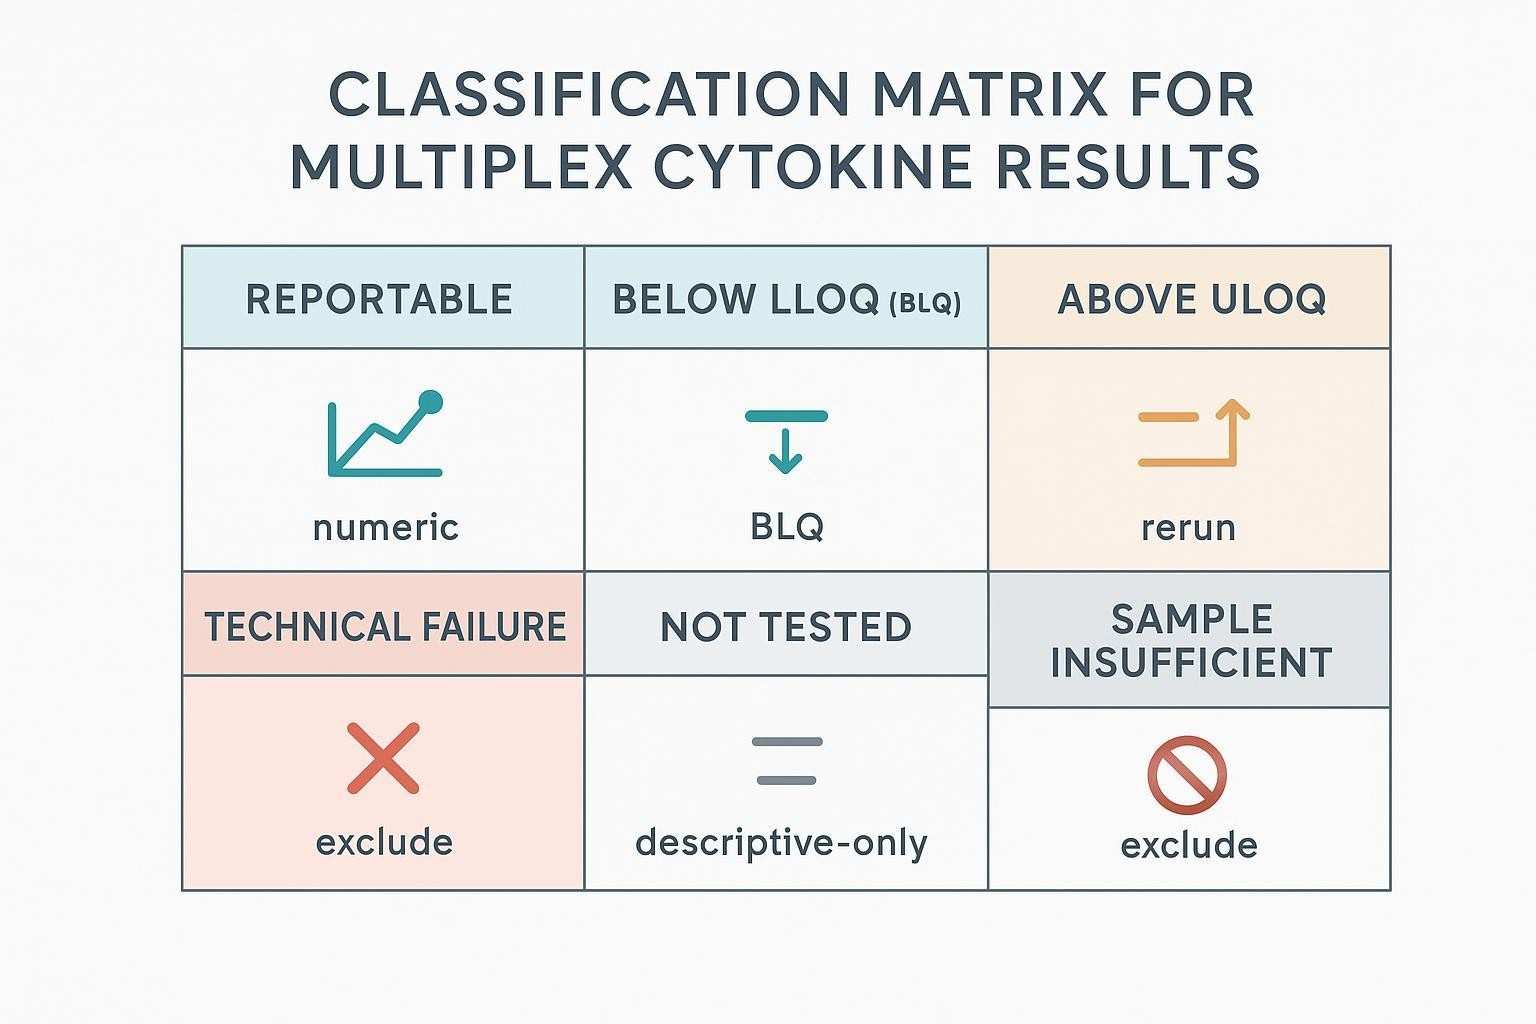
Below is a compact table version of the classification matrix to support implementation.
| Category | Definition | Primary reporting action | Modeling note |
|---|---|---|---|
| Quantifiable/reportable | Within validated range; QC passed | Report numeric value | Use as continuous |
| BLQ (<LLOQ) | Signal may be present but not reliably quantifiable | Report as BLQ; no numeric | Prefer left-censored methods or justified substitution |
| >ULOQ | Above validated range | Dilute/re-assay; if unresolved, annotate as non-quantifiable high | Consider right-censoring or exclude |
| Technical failure | Acquisition/fit failure (e.g., bead count too low; failed standards/controls) | Exclude from quantitative outputs; track in audit trail | Exclude from modeling |
| Not assessed | Analyte not tested by design | Record NA with reason | Exclude |
| Sample insufficient | Inadequate volume to test | Record as insufficient | Exclude |
| QC-excluded | Excluded post-QC per predefined rule | Keep visible in footnotes/audit log | Exclude; document rationale |
References anchoring principles include the FDA’s guidance for BLQ reporting and the ICH M10 transparency for calibration/range acceptance (FDA BMV, 2018; ICH M10, 2022).
What Should Be Predefined Before Study Start
Before the first production run begins, the study should already have a written position on what counts as reportable, what counts as censored, and what will no longer be treated as quantitatively usable. In multiplex cytokine work, these questions are not edge cases. Different analytes will almost always show different detectability patterns, different susceptibility to QC failure, and different rerun value. If the rules are left open until review, the handling of BLQ values, >ULOQ results, technical failures, or exclusions can start to drift with the dataset itself.
What needs to be fixed in advance is not only the technical handling of data points, but the logic behind those decisions. Teams should decide early how low-end and high-end non-reportable values will be labeled, when reruns are justified, which missing-value categories must remain visible, and what kinds of QC outcomes move a result from reportable to qualified or excluded. Just as importantly, those rules should reflect the purpose of the study. A broad exploratory screen may allow some markers to remain descriptive-only, whereas a decision-critical biomarker workflow may require much tighter boundaries around reportability and rerun eligibility.
Predefinition also matters because data policy does not end at assay review. The same logic has to carry through into tables, figures, and collaborator-facing summaries. If one part of the workflow labels a result as BLQ, another silently converts it to zero, and a third drops it from the final plot, the project no longer has a policy—it has a series of undocumented handling choices. A strong study plan avoids that fragmentation by linking assay review, missingness classification, rerun logic, and reporting language before any production data are interpreted.
Before study start, make sure the policy is explicit in four areas:
- Range handling
Define how <LLOQ and >ULOQ v - alues will be labeled, when rerun is allowed, and when results remain descriptive or non-quantifiable.
- Missingness classification
Separate BLQ, technical failure, not tested, sample insufficient, and QC-excluded states so they do not collapse into one generic blank. - QC filtering and rerun logic
Decide which failures trigger exclusion, qualification, or retesting, and whether those rules differ by analyte tier or study objective. - Reporting and analysis boundaries
Align tables, figures, and downstream analyses with the same policy so that non-reportable and excluded values remain interpretable rather than silently redefined.
How to Handle Below LLOQ Values
The main policy options
- Keep as a flagged <LLOQ category
- Replace with a predefined proxy value for selected analyses
- Exclude from analyses requiring quantified concentrations
- Treat as descriptive presence/absence in narrowly justified contexts
What should guide the choice
- Study objective
- Proportion of <LLOQ values for the analyte
- Whether the analyte is decision-critical or exploratory
- Whether the chosen method preserves interpretability rather than convenience
Why one rule for every analyte may be misleading
- Cytokines differ in abundance, biology, and expected detectability
- A panel-wide shortcut can simplify workflow but weaken biological credibility
- Decision-critical markers may need stricter treatment than exploratory ones
When rerun may be justified
- The analyte is critical to the study decision
- There is reason to believe dilution or technical setup caused avoidable loss of low-end signal
- Sufficient sample remains and rerun rules were predefined
For multiplex breadth with moderate sensitivity, a Luminex-based policy can work well; where persistent BLQ undermines objectives for critical cytokines, consider escalating sensitivity or adjusting dilution strategies. For example, some teams move critical low-abundance targets to ultrasensitive assays when justified; see internal resources on platforms such as Luminex Multiplex Cytokine Detection , MSD Multiplex Electrochemiluminescence Assays , or Simoa Ultrasensitive Cytokine Assays for context on fit-for-purpose choices.
How to Handle Missing Values in Downstream Analysis
Keep reporting separate from modeling
- A value-handling rule suitable for a table may not be appropriate for a statistical model
- The policy should distinguish presentation logic from inferential logic
- Tables, heatmaps, clustering inputs, and regression models may require different treatment decisions
Questions to answer before analysis begins
- Will analytes with excessive missingness be removed from specific analyses?
- Will censored values be summarized differently from true missing values?
- Will descriptive visualizations include more markers than formal statistical models?
- How will sample-level missingness affect inclusion in multivariate analyses?
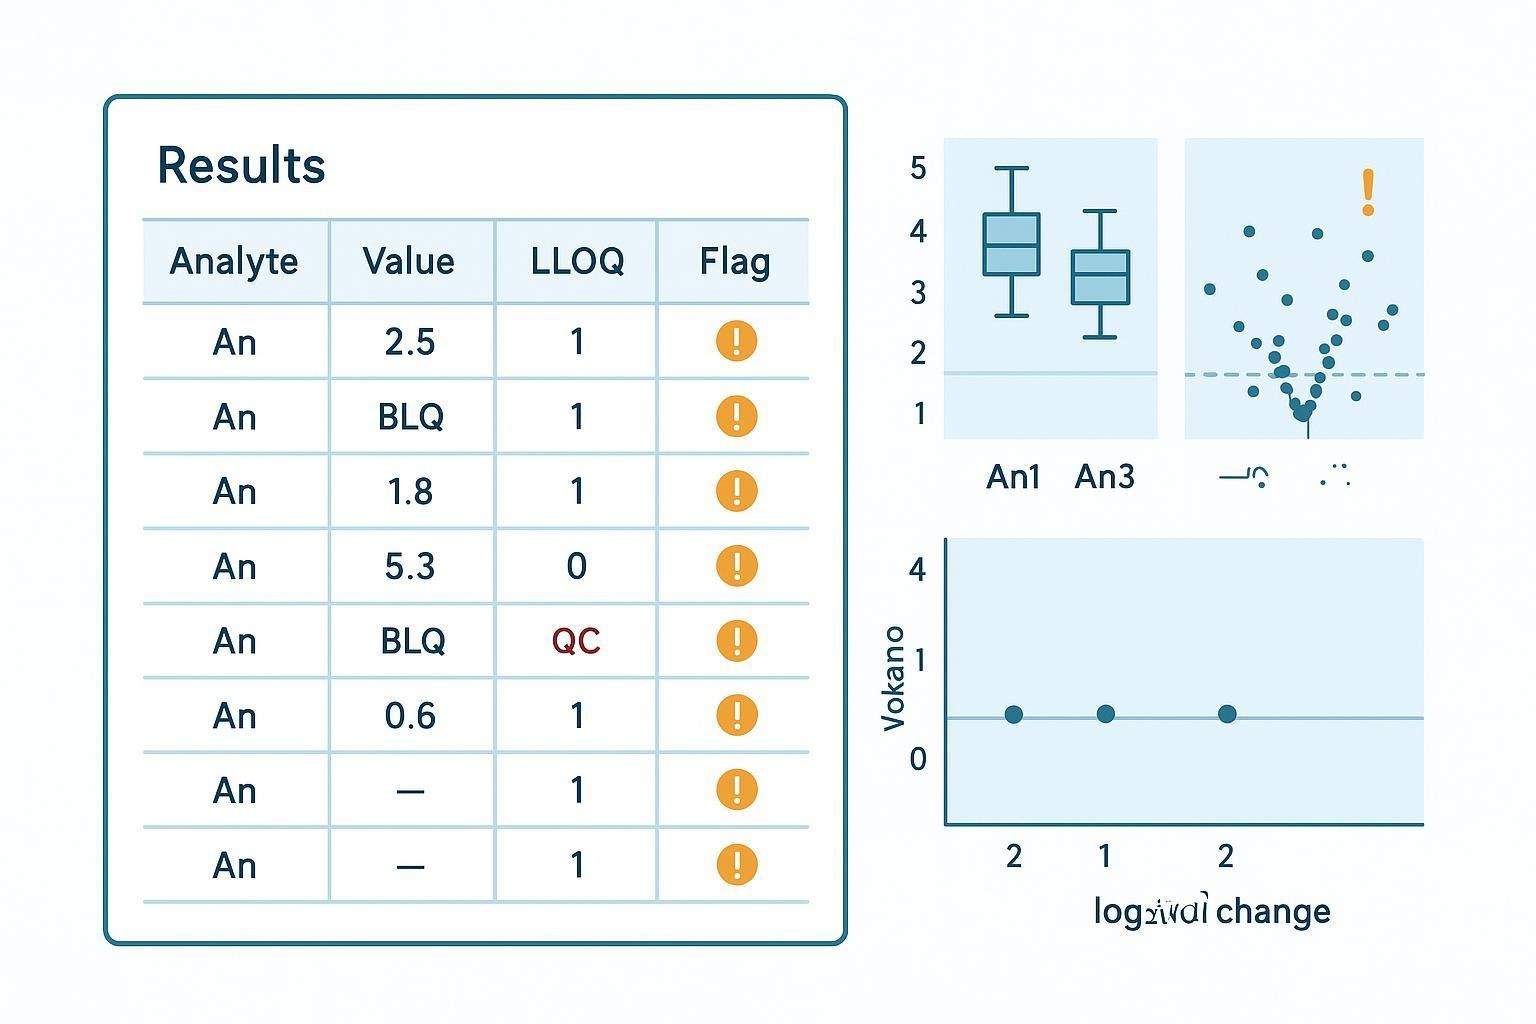
Study-level consequences of poor missing-value design
- Artificial group separation
- Misleading fold-change summaries
- Overstated pattern clarity in PCA or clustering
- Biased comparison between cohorts or timepoints
Relevant modeling guidance favors likelihood-based approaches for left-censored data when BLQ proportions are material, rather than blanket substitution (AAPS/PK left-censoring guidance, 2012–2015).
What QC Filtering Should and Should Not Do
QC filtering is not a cleanup shortcut
- The purpose of filtering is to protect interpretability, not to beautify data
- Filtering should remove data that are not fit for the intended use
- Filtering should not be used to selectively strengthen a preferred biological story
Typical QC filtering domains
- Plate-level validity
- Standard curve performance
- Control performance
- Analyte-specific instability
- Replicate inconsistency, where applicable
- Persistent non-reportability beyond predefined tolerance
Below is a compact table to translate these domains into action.
| QC domain | Typical checks (examples) | Policy action (range + caveat) |
|---|---|---|
| Plate-level validity | Control positions, background, drift | Exclude plate if control failures exceed pre-set limits; document in audit log |
| Curve performance | 4PL/5PL fit, back-calculated standards | Contract range if LLOQ/ULOQ fail; rerun if major deviations persist |
| Controls | Low/medium/high QC recovery and CV | Accept/qualify/exclude based on fit-for-purpose bands (e.g., ±20–30% near LLOQ) |
| Bead counts | Per-analyte beads per region | Flag <35–50 beads; consider rerun or non-reportable classification (vendor guidance) |
| Replicates | Intra-well or inter-well %CV | If beyond tier-specific limits, qualify or rerun |
| Analyte instability | Batch-to-batch drift, trend charts | Qualify/exclude analyte for batch; consider bridge controls |
Citations for principles: ICH M10 (run acceptance and calibration), vendor QC guidance on bead counts and troubleshooting, and methods literature on multiplex QC (ICH M10, 2022; MILLIPLEX QC guidance; drLumi methods).
What should happen after a QC flag
- Accept as reportable
- Accept with qualification
- Trigger rerun
- Exclude from quantitative analysis
- Retain as descriptive-only output
Analyte-Level Versus Panel-Level Filtering
Why panel-wide rules are often insufficient
- Some analytes are robust across all batches, while others are intrinsically fragile
- Panel-wide decisions can hide analyte-specific problems or over-penalize strong markers
- Filtering should reflect the actual technical behavior of each marker
When analyte-level review becomes essential
- Large differences in detectability across cytokines
- High-value markers near the assay limits
- Longitudinal or cross-batch studies where selective instability matters
- Studies mixing exploratory and decision-grade readouts
A practical tiering model
- Tier 1: must-report analytes with stricter inclusion rules
- Tier 2: important but secondary markers
- Tier 3: exploratory markers with more descriptive handling allowed
A custom panel design and validation plan helps operationalize tiering across platforms. If you need design support (e.g., balancing dynamic range, expected BLQ rates, and rerun eligibility) see Custom Panel Design and Method Validation for context.
FAQ
Is below LLOQ the same as zero?
No. BLQ indicates potential presence without reliable quantification under current assay conditions; report as BLQ without a numeric value (FDA BMV, 2018).
Should all missing values be treated the same way?
No. Classify missingness (BLQ, >ULOQ, technical failure, not tested, insufficient, QC-excluded) before analysis; each has different reporting and modeling implications (see ICH M10 transparency principles: ICH M10, 2022).
When should a cytokine be excluded from quantitative analysis?
When predefined QC or reportability rules indicate results aren’t fit for the intended use (e.g., failed controls, unstable curve, insufficient bead counts), not because values contradict an expected trend.
Can a marker remain in the report even if many values are below LLOQ?
Sometimes. For exploratory analytes, maintain BLQ visibility and label outputs as descriptive-only; for decision-critical analytes, consider rerun, dilution adjustment, or higher-sensitivity platforms if justified.
Should the same data handling rule apply to every analyte in a multiplex panel?
Usually not. Use analyte-level tiering (Tier 1/2/3) so that critical markers meet stricter criteria while exploratory markers allow descriptive handling.
People also ask: What’s the difference between LOD and LLOQ in cytokine assays?
LOD reflects detectability (presence vs absence), while LLOQ reflects the lowest level meeting predefined precision/accuracy for quantification; in many cytokine LBAs the LLOQ aligns with LoQ under validated conditions (CLSI EP17 concepts; ICH M10 range acceptance).
How do you handle values above ULOQ?
Dilute and re-assay to bring values into range; verify dilution linearity and check for hook effects. If unresolved, report as non-quantifiable high with qualification.
What bead count is acceptable in Luminex assays?
Vendor guidance often targets ≥50 beads per analyte region (with ~35 as a practical lower bound); below this, precision and reliability can degrade, prompting qualification or rerun.
References:
- ICH Expert Working Group. ICH M10: Bioanalytical Method Validation (Step 5, 2022). European Medicines Agency. Available at: https://www.ema.europa.eu/en/documents/scientific-guideline/ich-guideline-m10-bioanalytical-method-validation-step-5_en.pdf
- U.S. Food and Drug Administration. Bioanalytical Method Validation Guidance for Industry (2018). Available at: https://www.fda.gov/files/drugs/published/Bioanalytical-Method-Validation-Guidance-for-Industry.pdf
- Díaz I et al. drLumi: An open-source package for the analysis of data from Luminex assays. BMC Bioinformatics. 2017;18: 9. Available at: https://pmc.ncbi.nlm.nih.gov/articles/PMC5685631/
- Andreasson U et al. A practical guide to immunoassay method validation and common pitfalls in multiplex protein measurements. Bioanalysis. 2016;8(8): 659–677. Available at: https://pmc.ncbi.nlm.nih.gov/articles/PMC4706274/
- Cengiz B et al. The Hook Effect: An Underrecognized Cause of Erroneous Immunoassay Results. Lab Medicine. 2017. Available at: https://pmc.ncbi.nlm.nih.gov/articles/PMC5556679/
- Keizer RJ et al. Handling Below the Limit of Quantification Data in Pharmacokinetic Analyses. CPT Pharmacometrics Syst Pharmacol. 2015;4(12): 711–725. Available at: https://pmc.ncbi.nlm.nih.gov/articles/PMC4448983/
- MILLIPLEX Multiplex Assays: Equipment Settings and Data Analysis Guidance. MilliporeSigma. Available at: https://www.sigmaaldrich.com/US/en/technical-documents/product-supporting/milliplex/equipment-settings-data-analysis-milliplex-multiplex-assays
- Li G et al. Advances in ultrasensitive protein detection using digital immunoassays. 2023. Available at: https://pmc.ncbi.nlm.nih.gov/articles/PMC10326690/
- ECL-based immunoassays in translational research: performance and applications. 2022. Available at: https://pmc.ncbi.nlm.nih.gov/articles/PMC9357438/