
Chronic graft-versus-host disease (cGVHD) unfolds over months to years after allogeneic hematopoietic cell transplantation (allo-HCT). Cytokine and chemokine signals rise and fall with flares, steroid bursts, tapering, and second-line therapy. In this landscape, cGVHD biomarker panels must be designed as longitudinal programs, not one-off experiments. The centerpiece is a bridging strategy that anchors data across plates, batches, lots, operators, and sites—so we can trust that an apparent trajectory reflects immune biology rather than assay drift.
Why This Study Design Question Matters in cGVHD
cGVHD immune activity is not static. Patients may be stable for weeks and then experience a flare that coincides with a steroid change or a targeted agent. If your study only captures a narrow window, you can easily miss the arc of immune behavior. Most importantly, longitudinal cytokine studies rarely finish in a single run. Multiple plates and kit lots are the rule, not the exception, especially in multicenter projects. That means cross-run comparability is a design requirement from day one.
The concept of bridge controls emerges precisely because within-run controls do not solve between-run problems. When placed consistently across time, bridges reveal and help correct technical movement that otherwise masquerades as biology.
Which Biomarkers Are Most Relevant in cGVHD Panel Design
Chemokine-driven trafficking and inflammatory regulation recur across cGVHD studies. Rather than relying on single markers, panels should blend chemokines with inflammatory and regulatory cytokines, and—when justified—select non-cytokine proteins that sharpen interpretability.
High-interest chemokines repeatedly studied in cGVHD
CXCL9 and CXCL10 are among the most frequently reported chemokines in cGVHD cohorts. In adjusted analyses, early post-transplant CXCL9 has been associated with subsequent cGVHD risk, while CXCL10 shows cohort- and graft-source–specific associations. These axes reflect interferon-inducible trafficking and often move in concert with other immune signals over time. The rationale for including trafficking-associated markers in serial monitoring is simple: they provide a window into sustained immune recruitment rather than momentary inflammation.
Cytokines that support inflammatory trend tracking
Panels routinely include IL-6 and TNF-α to follow proinflammatory motion alongside IL-10 as a counter-regulatory signal. Where interferon pathways are prominent, IFN-γ–related signals can contextualize chemokine shifts. Interpreted as trajectories across visits, these cytokines help separate treatment effects from disease-associated movement.
Non-cytokine markers often discussed alongside cytokine panels
Select non-cytokine proteins can strengthen interpretation: BAFF (B-cell dysregulation), ST2/IL1RL1 (epithelial/alarmin pathways), and tissue remodeling or macrophage-related proteins such as REG3α, MMP3, DKK3, and sCD163 in extended or exploratory designs. REG3α is primarily associated with aGVHD and GI involvement; in cGVHD its utility is context-dependent and should be justified by scope.
How marker selection should follow the study question
Marker choice should mirror the longitudinal objective—risk-enriched follow-up after transplant, response monitoring during immunosuppressive adjustment, or organ-focused translational work (skin, lung, ocular). Discovery panels can cast a wider net in early pilots, while repeatable follow-up panels should emphasize detectability and stability across treatment phases.
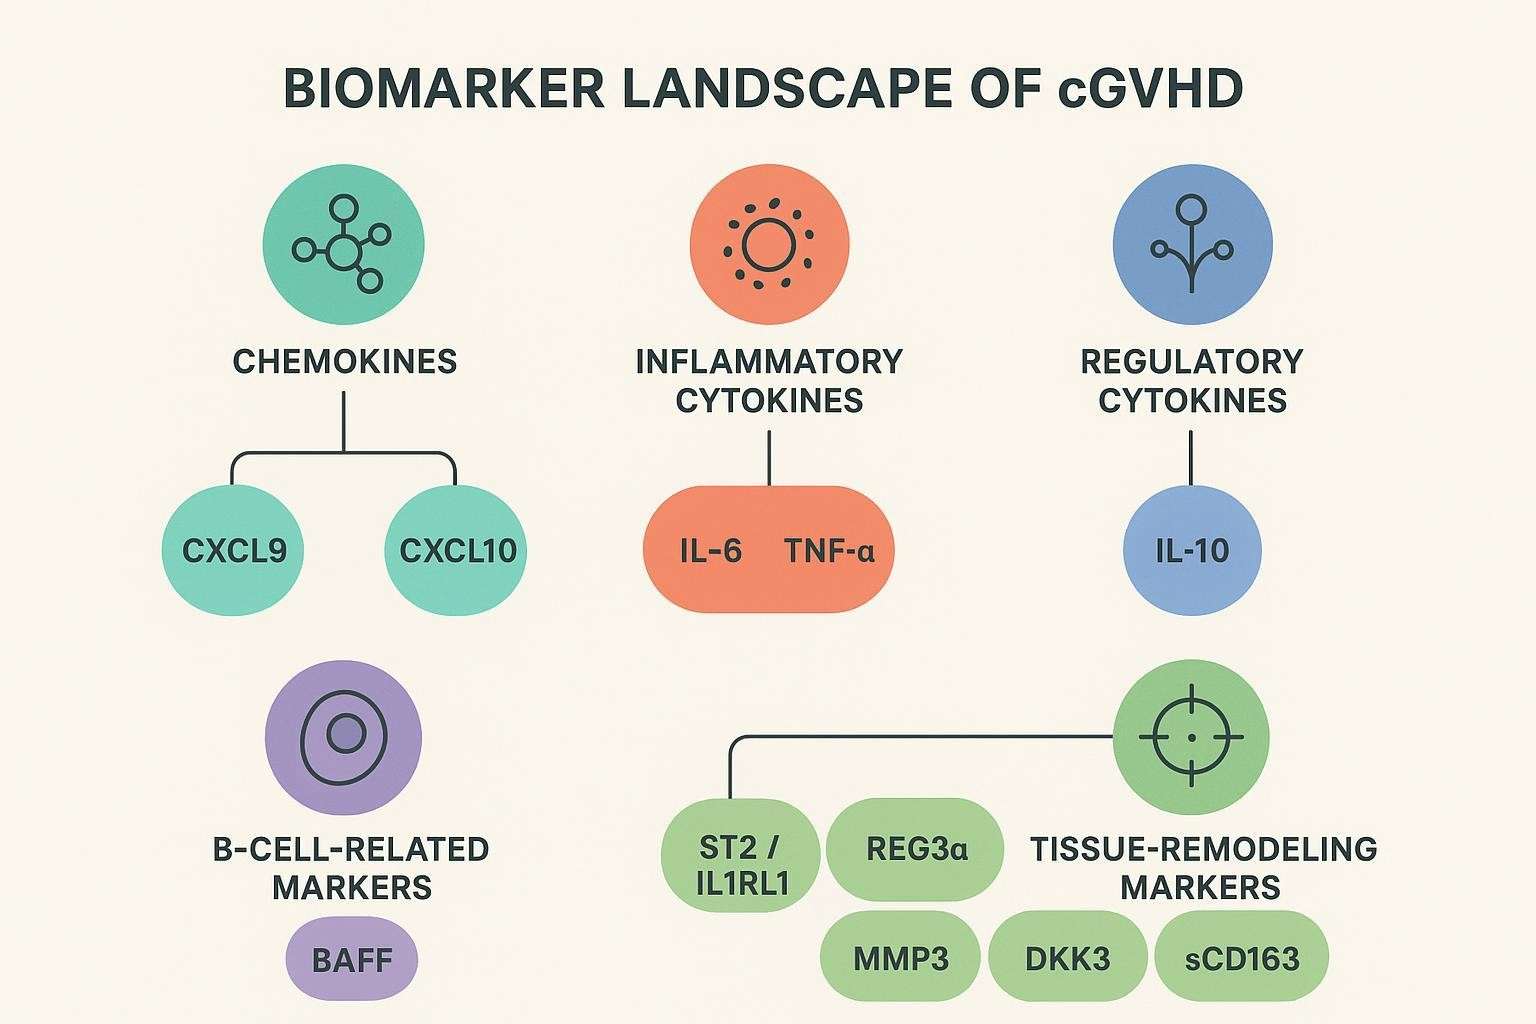
Table 1. Frequently reported soluble biomarkers in cGVHD and how to use them
| Class | Example markers | Why include them longitudinally | Practical notes |
|---|---|---|---|
| Chemokines | CXCL9, CXCL10 | Track interferon-inducible trafficking over time | Often move together; associations vary by graft source and timepoint |
| Inflammatory cytokines | IL-6, TNF-α | Capture inflammatory surges and flares | Sensitive to therapy exposure; read as trends |
| Regulatory cytokines | IL-10 | Contextualize anti-inflammatory shifts | Can rise with steroid use |
| B-cell related | BAFF | Reflect B-cell dysregulation | Useful in phenotypes with humoral features |
| Tissue remodeling/alarmins | ST2, MMP3, DKK3, sCD163 | Add interpretive depth for severity and organ involvement | Consider detectability and matrix effects |
| GI-epithelial (contextual) | REG3α | GI involvement signal (aGVHD-leaning) | Use when GI scope is explicit |
How to Choose Between a Broad Discovery Panel and a Focused Longitudinal Panel — cGVHD biomarker panels
Broad discovery panels make sense for early-stage hypothesis generation and small pilot cohorts. They surface candidates that may become “bridge-worthy” analytes in scale-up. But once you commit to multicenter, multi-batch work with repeated patient sampling, a focused panel typically outperforms broader sets in practical terms: better detectability, fewer missing values, and clearer interpretation across therapy phases.
A pragmatic way to reduce complexity without losing biological value is to keep analytes with repeated literature support and drop those that show persistent low detectability or unstable run-to-run behavior. Prefer markers that remain interpretable across steroid bursts, tapering, and targeted switches.
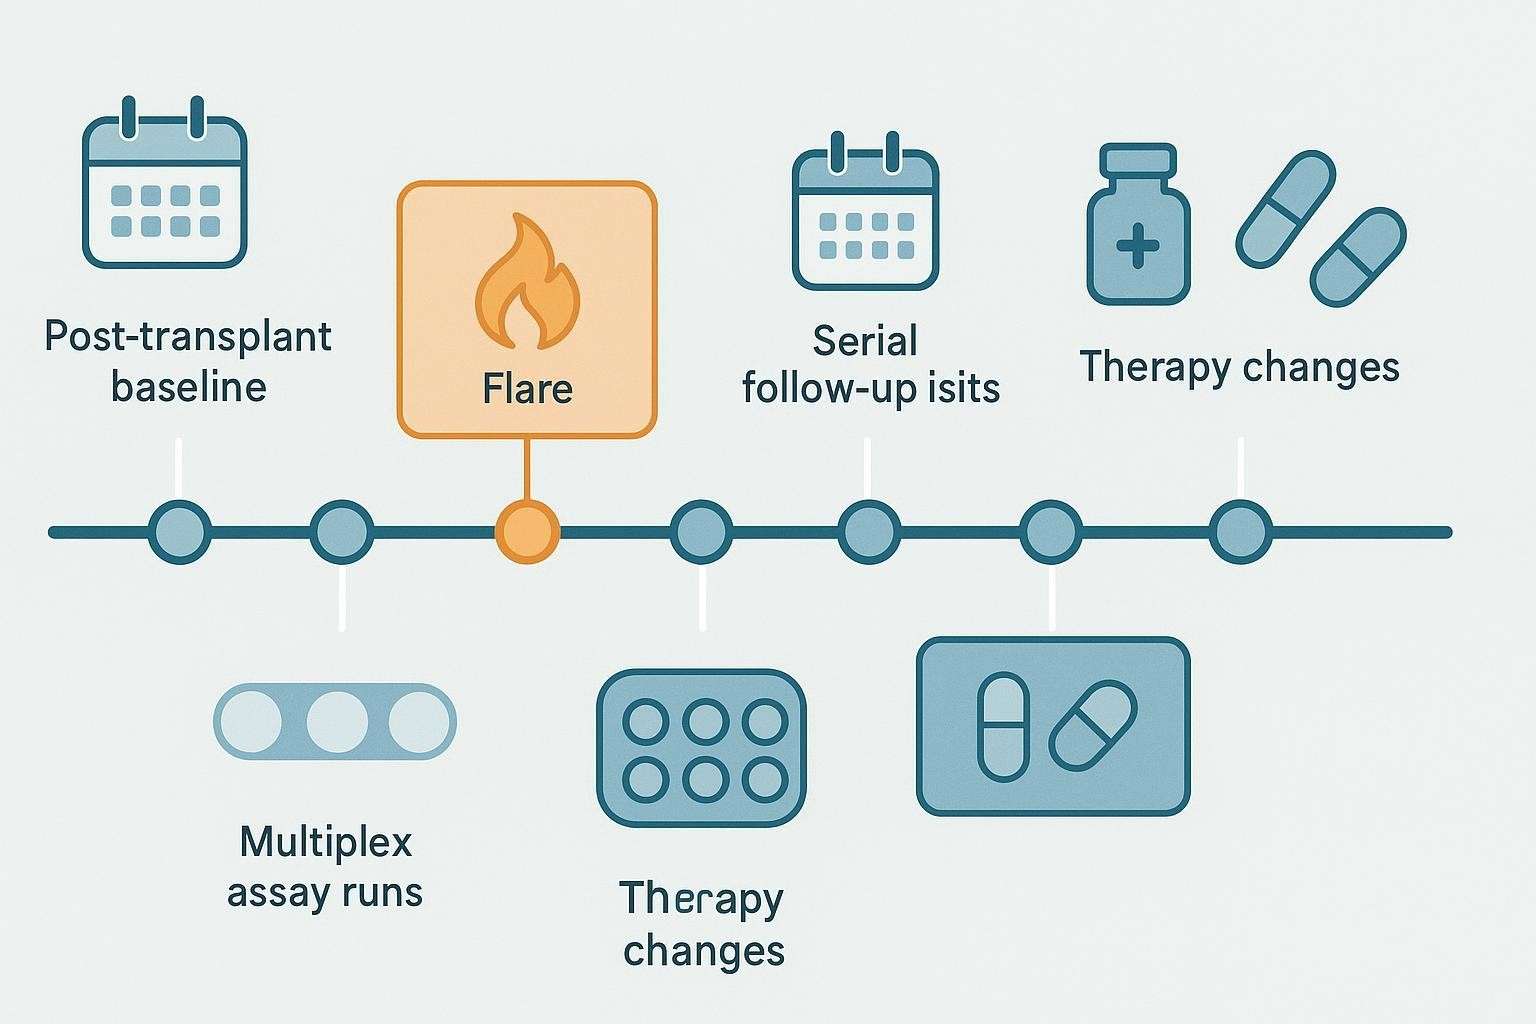
When to Collect Samples in a Longitudinal cGVHD Cytokine Study
Sampling must be anchored to clinical cadence. A pre-cGVHD or early reference sample (often near day 90 post-HCT where some chemokines show predictive value) provides a baseline. Routine follow-ups at fixed intervals build trajectories during stable management. Around flares, taper events, and therapy changes, plan pre- and post-change windows to capture immune shifts. For organ-focused studies (ocular, pulmonary, cutaneous), add timepoints aligned to severity scoring visits.
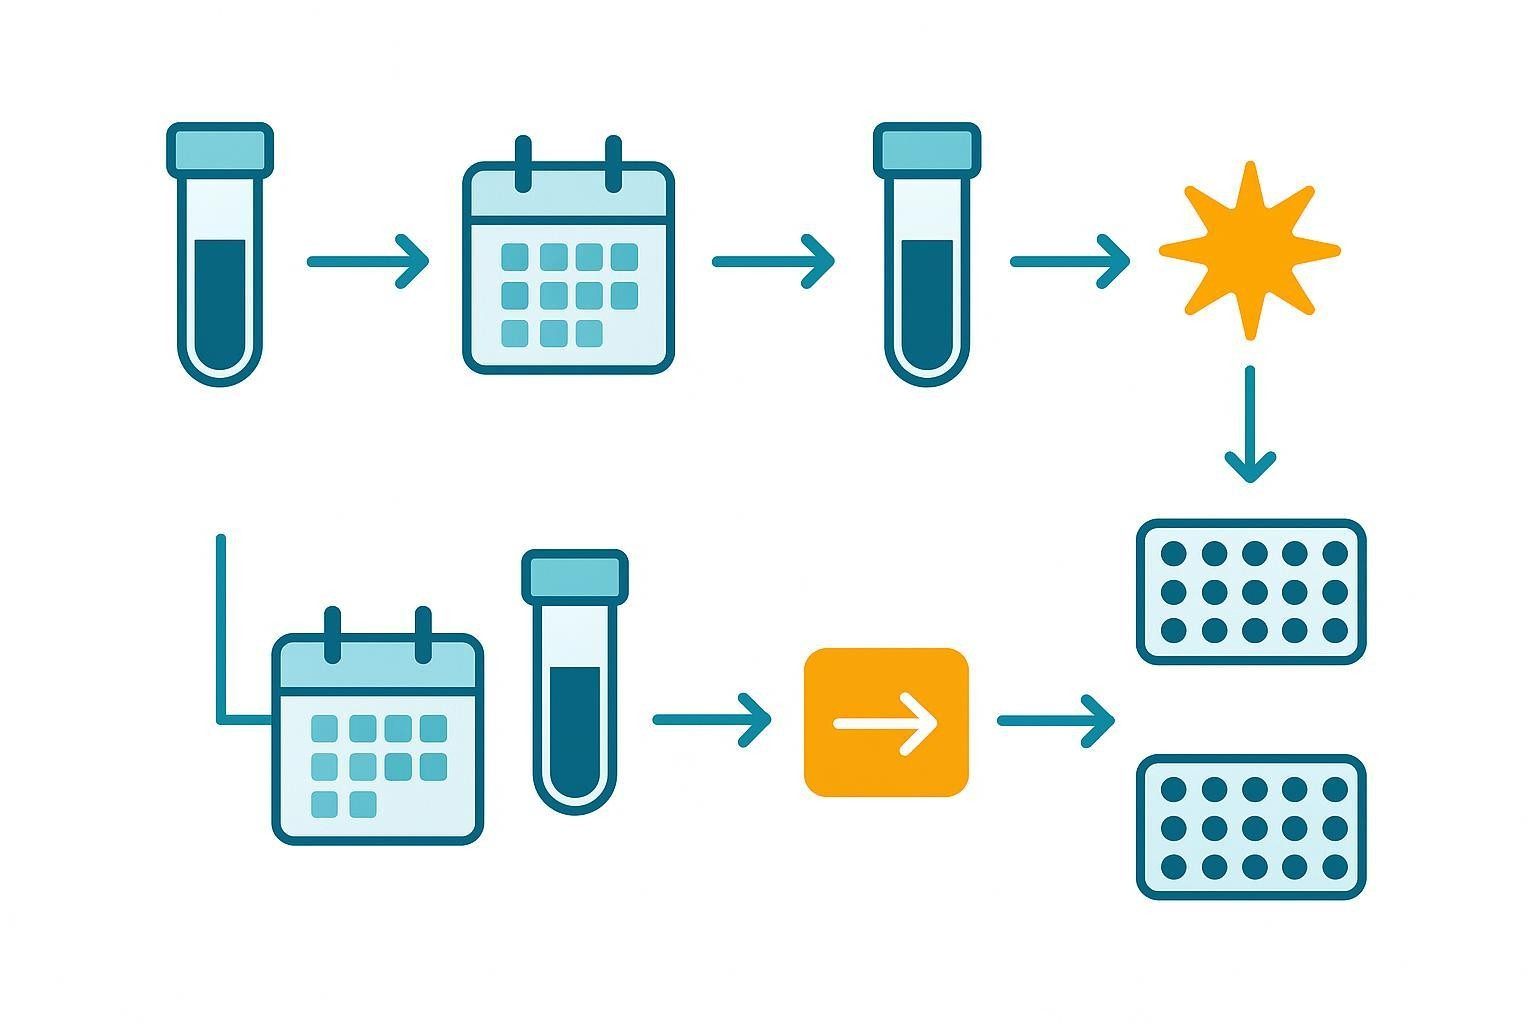
Table 2. Example longitudinal sampling framework (adapt as protocols require)
| Study phase | Typical window | Purpose | Notes |
|---|---|---|---|
| Early reference | ~Day 90 post-HCT | Establish baseline risk context for chemokines | Align with clinical visit |
| Stable management | Every 4–8 weeks | Build trajectories | Keep timing consistent |
| Flare window | -2 to +14 days around flare | Capture surge/resolution | Pair with clinical scoring |
| Therapy change | ≤7 days before and 14–28 days after | Map treatment effect | Include steroid taper bursts |
| Organ-focused add-ons | Match scoring visits | Synchronize with severity scales | Ocular, pulmonary, skin modules |
What Bridge Controls Actually Do in a cGVHD Biomarker Study
Bridge controls are shared materials that recur across plates, runs, batches, and sites. They connect data generated on different dates, reveal technical movement that may mimic biology, and support alignment of serial patient trajectories. Routine QC confirms acceptance within a run; bridge controls enable comparability across time.
Good bridge materials resemble study samples (matrix match), cover a broad enough subset of analytes to reflect panel behavior, and are available in sufficient, stable volume to last the project.
How to Select Bridge Control Material
Pooled study-matrix controls often provide the best matrix match and mirror cohort-specific behavior, assuming sufficient leftover volume is available. Reference plasma or serum materials favor long-term consistency and cross-site harmonization but require evaluation for detectability across your panel. A hybrid approach—combining pooled matrix with a long-term reference—is frequently the most durable choice. In broader panels, splitting bridges (e.g., inflammatory vs low-abundance) can improve reliability.
Before locking a bridge material, assess detectable ranges for priority analytes, freeze–thaw tolerance, between-aliquot consistency, and total inventory. Define acceptance criteria for %CV near LLOQ vs at mid/high signals and standardize aliquoting and storage prior to the first batch.
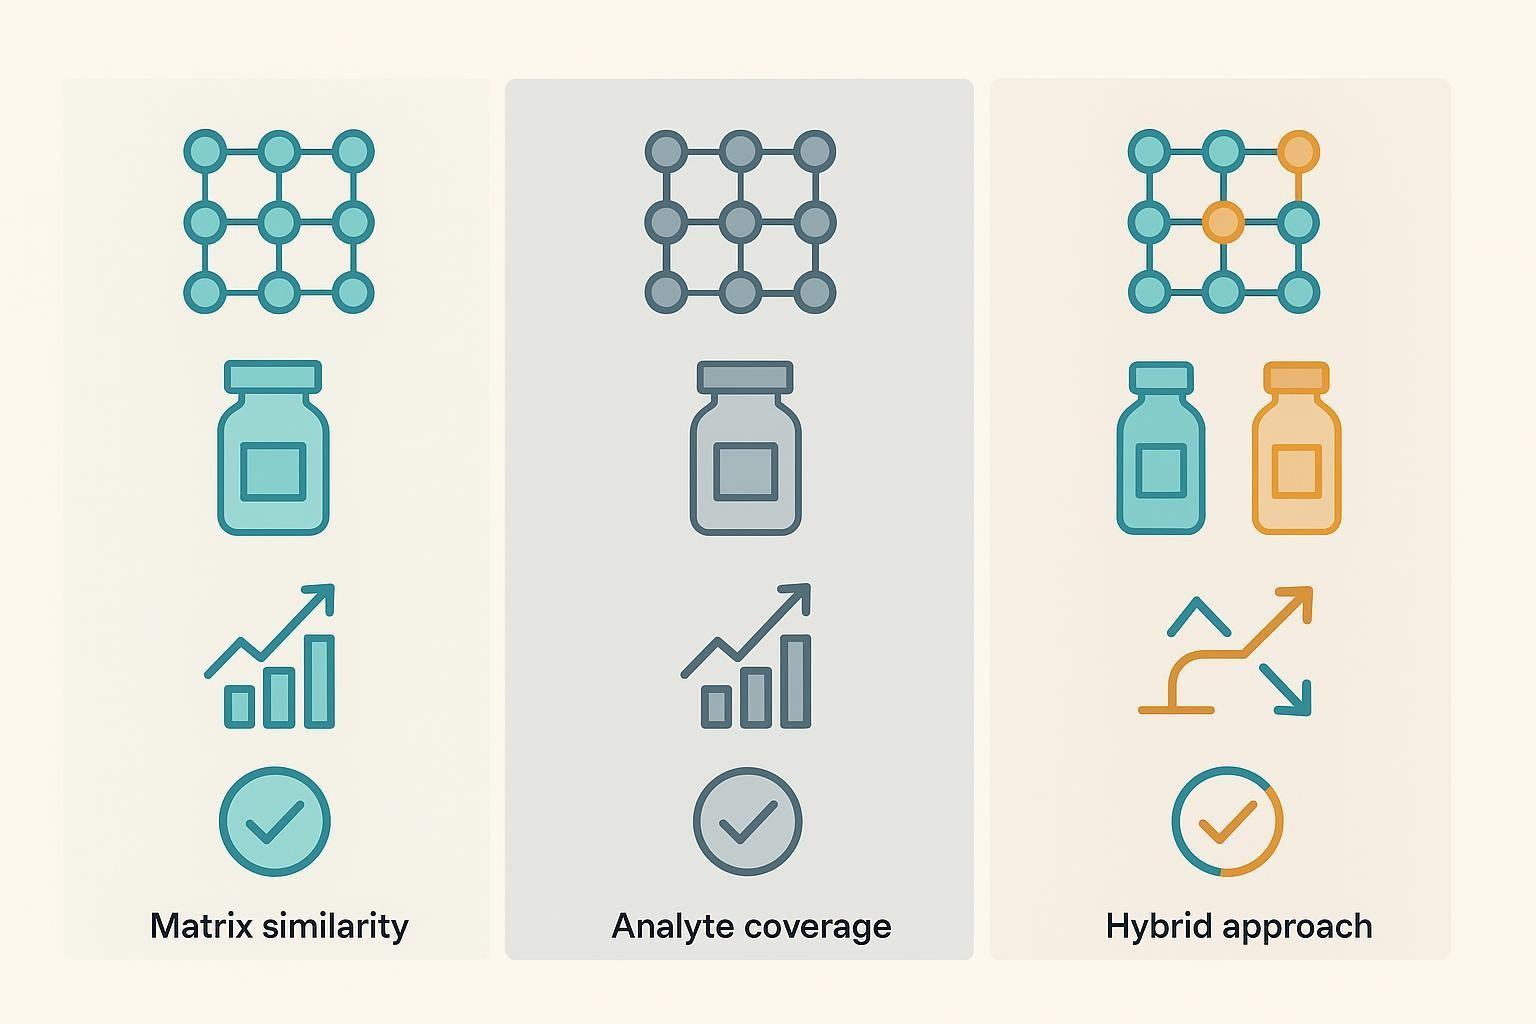
Table 3. Bridge-control options and pre-lock checks
| Option | Strengths | Limitations | Pre-lock checks |
|---|---|---|---|
| Pooled study matrix | Best matrix similarity; mirrors cohort behavior | Requires representative volume; operational prep | Detectability map; freeze–thaw; aliquot CV; inventory sizing |
| Reference serum/plasma | Long-term stability; cross-site standardization | May miss cohort-specific matrix effects | Detectability across panel; inter-site comparability |
| Hybrid (pooled + reference) | Combines realism and durability | Added logistics; role clarity needed | Dual detectability; class-split feasibility |
Practical example: In multicenter projects, teams often aliquot a pooled study-matrix bridge and, in parallel, a long-term reference bridge. The pooled bridge anchors cohort-specific behavior; the reference provides a stable across-site backbone. Platforms such as Creative Proteomics support multiplex implementations suitable for this hybrid strategy (Knowledge Base Source). When confirmatory, lower-plex, higher-sensitivity work is needed, a focused electrochemiluminescence panel can complement the discovery-phase multiplex (see MSD Assay Service for platform context) (Knowledge Base Source).
How to Place Bridge Controls Across Runs and Plates
Minimum placement logic in long-running studies is straightforward: include the same bridge control in every major assay batch and maintain consistent placement rules across plates. Avoid changing bridge materials mid-study; if unavoidable, run an overlap to cross-map old and new bridges and document the transition.
For higher-confidence alignment, use duplicate placement across plates and repeat bridge wells in larger batches. In multicenter designs, add site-level bridge placement so each laboratory anchors to a common reference. Intensify bridge density around change points (new reagent lot, long time gaps, operator switch, platform maintenance, or study expansion).
How to Read Longitudinal Data Without Confusing Drift for Biology
Begin by examining bridge-control behavior. Are signals within expected movement limits? Are shifts panel-wide (suggesting run or lot effects) or analyte-specific? Batches that deviate should be investigated before patient data are interpreted.
Next, read patient results as trajectories, not isolated timepoints. Look for directional patterns across visits and coordinated movement among related analytes—for instance, CXCL9/CXCL10 with IL-6/TNF-α. Finally, map treatment events (steroid bursts, tapering, pathway-targeted agents) to sampling windows to separate therapy effects from disease-associated immune motion.
Normalization options include bridge-based scaling using repeated control materials and statistical correction approaches (e.g., mixed-effects or empirical Bayes batch adjustment). Use these carefully: over-correction can suppress real biology.
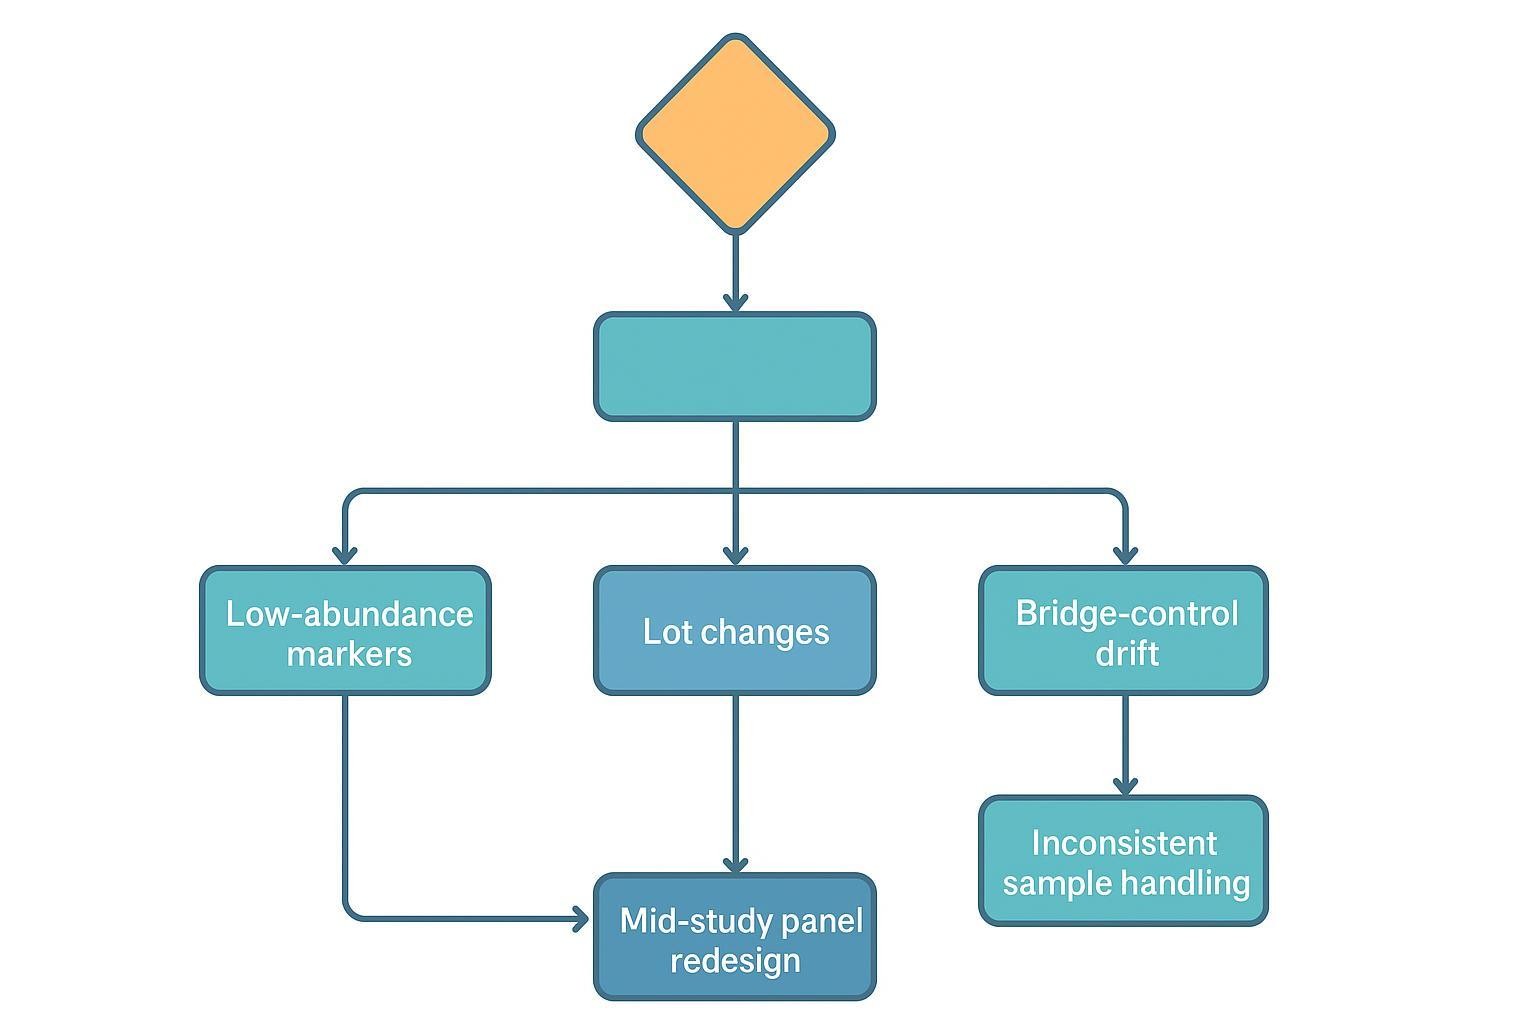
How to Handle Common Analytical Problems in cGVHD Projects
Low-abundance analytes: If repeated runs yield values below quantifiable range, consider removing the marker from the longitudinal backbone or using a higher-sensitivity/orthogonal assay for confirmatory reads. Reassess parallelism and matrix effects.
Lot changes: Pre-plan transitions and increase bridge placement density around the change. Document recalibration and any normalization decisions with curve comparisons and diagnostics.
Inconsistent sample handling: Variability in processing delay, storage, or freeze–thaw cycles can distort trends. Standardized SOPs and training at every site are essential.
Panel redesign mid-study: Avoid if possible. If necessary, preserve a core analyte backbone and run overlap batches to protect continuity between versions.
How to Structure a More Durable cGVHD Biomarker Study
Define the primary longitudinal question first—early immune divergence after transplant, serial monitoring during established cGVHD, response tracking during therapy modification, or organ-specific immune activity over time. Then build the panel around repeatability: prioritize markers with credible cGVHD relevance and practical assay performance, and retire attractive but non-robust analytes early. Lock your control strategy before enrollment scales up: select bridge materials, calculate total volume, and standardize aliquoting and storage. Finally, predefine how data will be reviewed across time: rules for batch acceptance, bridge-triggered investigations, handling of missing or unstable analytes, and interpretation around treatment events.
Where platform trade-offs matter—for example, balancing plex against sample volume and dynamic range—teams often start with a bead-based discovery panel and then confirm a subset with electrochemiluminescence or proximity extension assays. For practical platform context, see Luminex xMAP Technology Assay and MSD Assay Service (Knowledge Base Source). For a broader overview of capabilities and species-matched multiplex options relevant to preclinical or translational studies, visit the Cytokine Service hub (Knowledge Base Source).
FAQ for cGVHD Bridge-Control Design
Q1: Which markers are most commonly prioritized in cGVHD biomarker panels?
A: CXCL9 and CXCL10 are frequently reported in longitudinal cGVHD literature. Non-cytokine proteins such as BAFF, ST2, DKK3, MMP3, sCD163, and, in GI-focused contexts, REG3α, can add interpretive value. Final selection should be driven by the longitudinal question and detectability across visits, not by list length.
Q2: How many bridge controls should be used in a multi-batch study?
A: At minimum, place the same bridge material in every major batch and on each plate. Increase repetition (duplicates, site-level anchors) when studies span long intervals, introduce new lots, involve multiple sites, or deviate from the original run plan.
Q3: Is one bridge control enough for every analyte in a multiplex panel?
A: In focused panels, a single, well-characterized bridge may suffice. In broader panels with mixed abundance ranges, a hybrid approach—separate bridges for inflammatory mid–high abundance targets and low-abundance targets—often yields more reliable alignment.
Q4: What makes a cGVHD panel easier to interpret over time?
A: Stable detectability across visits, standardized pre-analytics, consistent and well-placed bridge controls, and deliberate alignment of sampling windows to clinical events. Reading trajectories—and corroborating movement across related analytes—improves confidence.
Q5: How should we normalize data across runs and sites without over-correcting?
A: Start with bridge-based scaling anchored by repeated control materials; then, if residual batch effects remain, consider mixed-effects or empirical Bayes adjustments. Always check that biological rank order and known relationships are preserved after correction.
Q6: When is a discovery panel preferable to a focused panel?
A: In early pilots or small cohorts aimed at pathway discovery. For scaled, multicenter longitudinal work, focused panels with robust detectability and lower missingness typically perform better.
References:
- Logan BR et al. Validated graft-specific biomarkers identify patients at risk for chronic GVHD. J Clin Invest. 2023. https://www.jci.org/articles/view/168575
- Milošević E et al. Use of the NIH consensus criteria in cellular and soluble biomarkers in chronic graft-versus-host disease. Front Immunol. 2022. https://www.frontiersin.org/articles/10.3389/fimmu.2022.1033263/full
- Goklemez S et al. Clinical characteristics and cytokine biomarkers in chronic GVHD. Am J Hematol. 2020. https://pmc.ncbi.nlm.nih.gov/articles/PMC8453587/
- DePriest BP et al. REG3α as a prognostic biomarker for gastrointestinal cGVHD. Blood Adv. 2022. https://pmc.ncbi.nlm.nih.gov/articles/PMC9131917/
- Dunbar SA. Multiplexed suspension array immunoassays for detection of immune responses. Methods Mol Biol. 2023. https://pmc.ncbi.nlm.nih.gov/articles/PMC10684963/
- Olink. Data normalization and standardization White Paper. 2018. https://7074596.fs1.hubspotusercontent-na1.net/hubfs/7074596/05-white%20paper%20for%20website/1096-olink-data-normalization-white-paper.pdf